Friday, April 6, 2018

Is Coal Dead in China?

Coal is still supplying 62 percent of China’s energy needs, according to 2016 data in BP’s Statistical Review of World Energy, compared to 15 percent for the United States.Further, according to China’s National Bureau of Statistics, coal consumption in China increased 0.4 percent in 2017, despite Beijing’s push to promote less-polluting energy sources. To deal with its major pollution problems, China, however, is focusing on clean coal technology—supercritical and ultra-supercritical plants that are about twice as efficient as subcritical boilers. (See chart below.) China represents 80 to 90 percent of the global market for advanced coal combustion power generation systems and associated environmental control systems. Not only is China building efficient coal plants in its own country, but Chinese companies are helping to build or finance hundreds of coal-fired power plants around the world. One such project is Kenya’s first 1050-megawatt coal-fired plant costing $2 billion located on some 975 acres.

Source: Center for American Progress

China’s Coal-Fired Projects around the World

China is building and/or financing over 200 coal-fired power plants in 31 countries–Mongolia to Zimbabwe, including countries like Kenya that had no previous coal plants. (See map below.) The coal plant in Lamu, Kenya will be the first of its kind in East Africa and will power an adjacent 32 berth deep-water port that is part of a plan to transform Kenya into an industrializing, middle-income country by 2030. It is financed with Chinese, South African, and Kenyan capital and built by the state-owned Power Construction Corporation of China. Power China has also constructed coal plants in Indonesia and Pakistan and is the 12th-largest developer of coal plants in the world.

Excluding projects in South Africa, over 100 coal-generating units are in various stages of planning or development in 11 African countries, and China is financing about half of them. The combined capacity of the units is 42.5 gigawatts—over eight times the region’s existing coal capacity. While not all are being financed by China, almost all are financed by foreign investment.

Pakistan is committed to building as many as 12 new coal-fired power plants over the next 15 years as part of a large infrastructure investment project that China and its partners are funding. About $33 billion will be spent on 19 energy projects that include coal-fired power plants, transmission lines, and other infrastructure as part of the China-Pakistan Economic Corridor. The majority of the new generating capacity (roughly 75 percent) will come from the new coal plants.

Chinese Companies Are Involved in More Than 200 Coal Projects in 31 Countries

Coal power projects with Chinese financing, construction or ownership:

Source: New York Times

U.S. vs. Chinese Coal Plants

As mentioned above, China is building advanced technology coal plants that are more efficient than most coal-fired power plants in the United States. An analysis of the top 100 most efficient coal plants in China and the United States shows major differences in advanced technology. While the top U.S. coal plants were built between 1967 and 2012, China’s top coal plants were built between 2006 and 2015. Of China’s 100 top plants, 90 are ultra-supercritical; while the United States has just one ultra-supercritical plant. China, however, still has a lot of dirtier and older coal plants. Of the 920 gigawatts of coal capacity in China, 19 percent is ultra-supercritical, 25 percent supercritical, and 56 percent subcritical. While China has canceled some coal-fired capacity due to lack of demand growth, China still plans to increase its coal-fired power plants to almost 1,100 gigawatts, which is over three times the coal-fired capacity of the United States.

Source: Vox

An explanation of the differences in these plant types is as follows:

Subcritical: In these conventional power plants, coal is ignited to boil water, the water creates steam, and the steam rotates a turbine to generate electricity. The term “subcritical” indicates that internal steam pressure and temperature do not exceed the critical point of water—705 degrees Fahrenheit and 3,208 pounds per square inch.

Supercritical: These plants use high-tech materials to achieve internal steam temperatures in the 1,000–1,050 degrees Fahrenheit range and internal pressure levels that are higher than the critical point of water, thus spinning the turbines much faster and generating more electricity with less coal and reduced emissions of criteria pollutants and carbon dioxide.

Ultra-supercritical: These plants use additional technology innovations to bring temperatures to more than 1,400 degrees Fahrenheit and pressure levels to more than 5,000 pounds per square inch, thus further improving efficiency.

A 1 percent increase in efficiency reduces such emissions of carbon dioxide, nitrogen oxide, sulfur dioxide, and particulates by 2 percent.

Conclusion

China still is using coal for over 60 percent of its energy requirements despite its pledge to the Paris Accord. With abundant coal resources, China continues to use coal to provide energy to its 1.3 billion people. That population, however, is demanding cleaner air from pollutants such as sulfur dioxide, nitrous oxides, and particulate matter, so China is wisely building supercritical and ultra-supercritical power plants in China and using the expertise gained from building them at home to gain new business and influence building coal plants abroad.


The post Is Coal Dead in China? appeared first on IER.

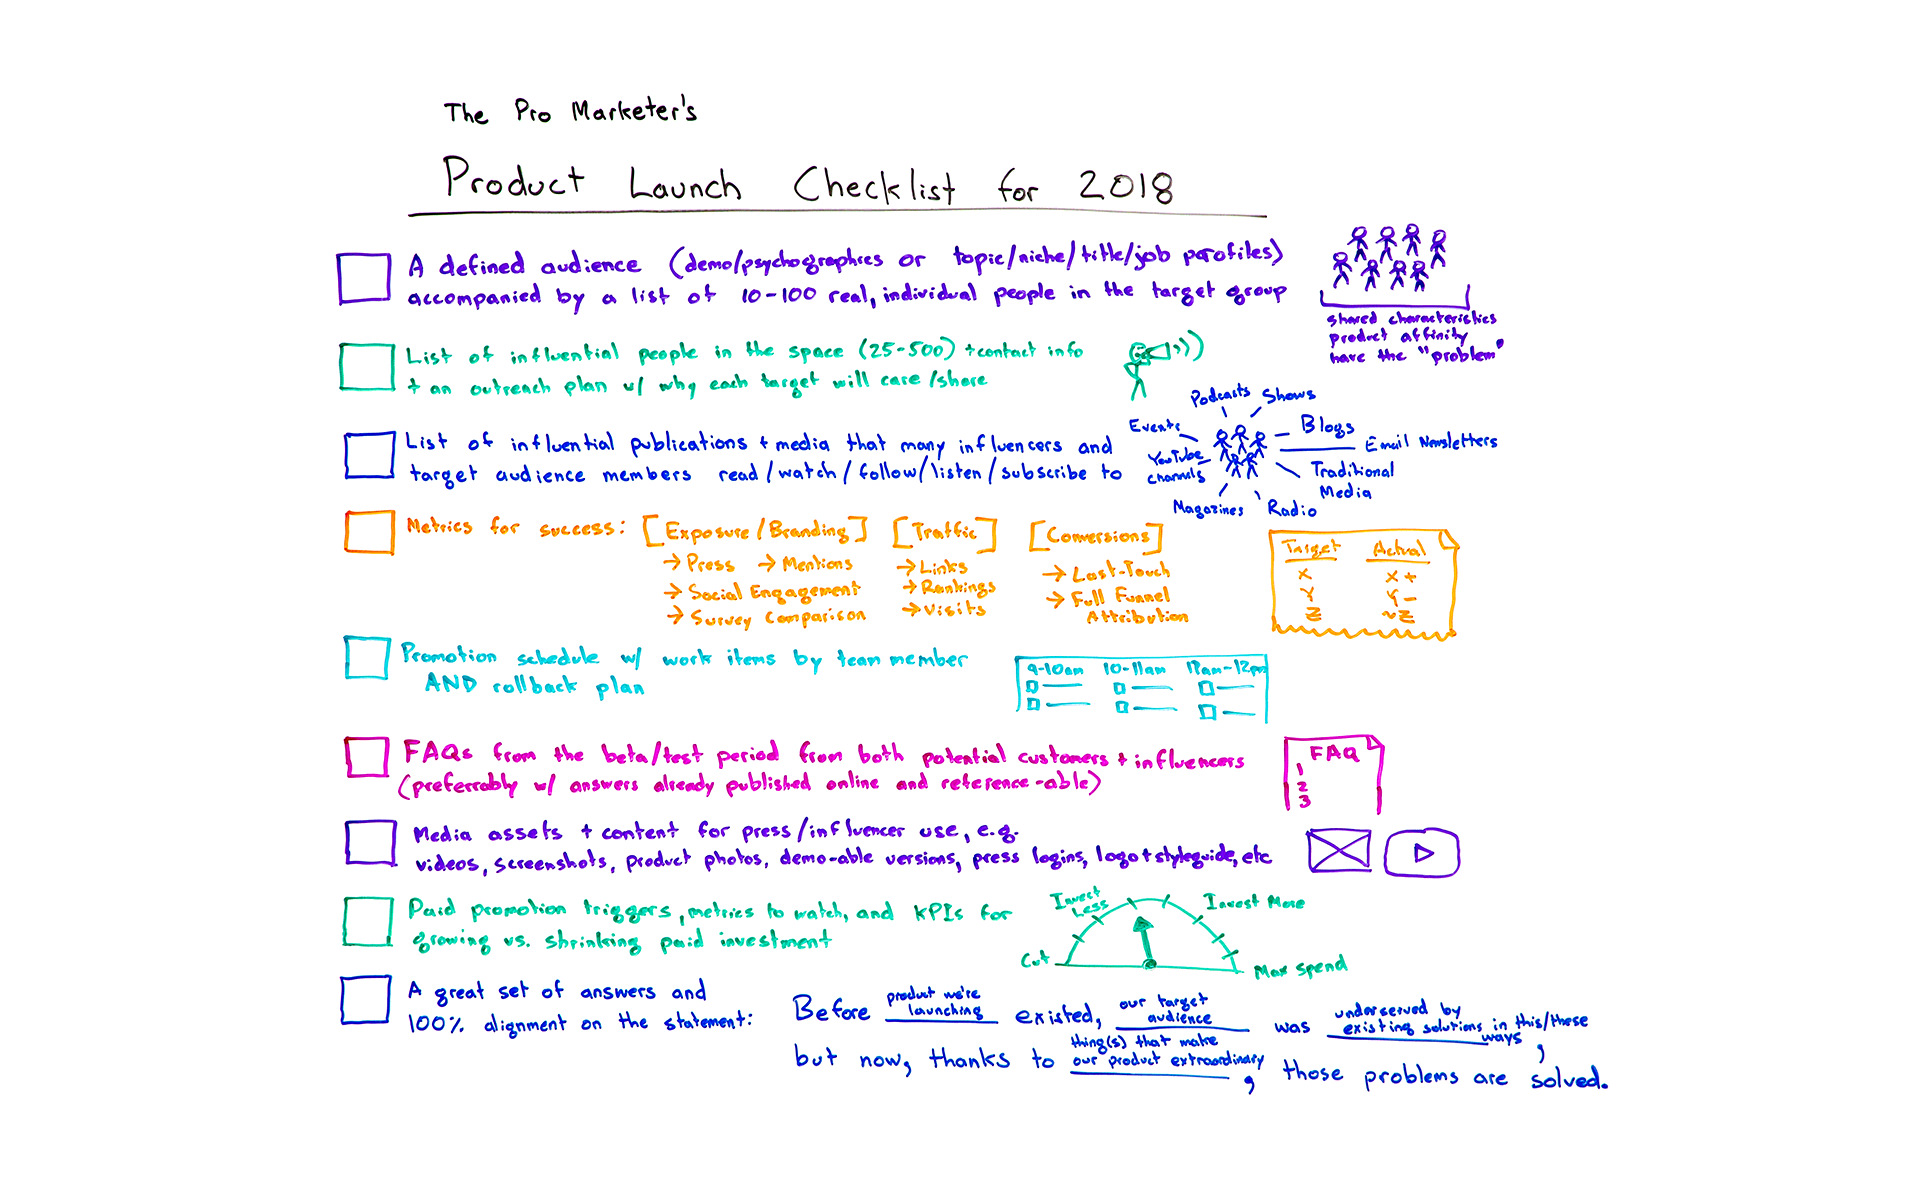
The Pro Marketer's Product Launch Checklist for 2018 - Whiteboard Friday

Posted by randfish

What goes into a truly exceptional product launch? To give your new product a feature the best chance at success, it's important to wrangle all the many moving pieces involved in pulling off a seamless marketing launch. From listing audience members and influencers to having the right success metrics to having a rollback plan, Rand shares his best advice in the form of an actionable checklist in this Whiteboard Friday. And make sure to check out the last item — it may be the best one to start with!

The Pro Marketer's Product Launch Checklist 2018

Click on the whiteboard image above to open a high-resolution version in a new tab!

Video Transcription

Howdy, Moz fans, and welcome to another edition of Whiteboard Friday. This week we are chatting about crafting a professional marketer's product launch checklist for 2018.

So many of you are undoubtedly in the business of doing things around SEO and around web marketing, around content marketing, around social media marketing in service of a product that you are launching or a feature that you are launching or multiple products. I think it pays for us to examine what goes into a very successful product launch.

Of course, I've been a part of many of these at Moz, as part of many of the startups and other companies that I advise, and there are some shared characteristics, particularly from the marketing perspective. I won't focus on the product and engineering perspectives. We'll talk about marketing product launches today.

☑ A defined audience, accompanied by a list of 10–100 real, individual people in the target group

So to start with, very first, top of our list, a defined audience. That can be a demographic or a psychographic set of characteristics that define your audience or a topic, a niche, a job title or job function type of characteristics that comprise the profile of who's in your group. That should be accompanied by a list of 10 to 100 real people.

I know that many marketers out there love using personas, and I think it's fine to use personas to help define this audience. But I'm going to urge you strongly to have that real list. Those could be:

  • Customers that you know you're targeting,
  • People who have bought from you in the past and you're hoping will buy again,
  • People who maybe you've lost and are hoping to recapture, maybe they use a competitor's product today or they're notable in some way.

As long as they fit your characteristics, I want you to have that list of those real people.

The problem with personas is you can't talk to them. You can't ask them real questions, or you can, but only in your own mind and your imagination fills in the details. These are real people that you can talk to, email, ask questions, show the product to, show the launch plan to and get real feedback. They should have shared characteristics. They should have an affinity for the product that you're building or launching, hopefully, and they should share the problem.

Whatever the problem, almost every product, in fact, hopefully every product is actually trying to solve a problem better than the thing that came before it or the many things that came before it. Your audience should share whatever that problem is that you're trying to solve.

☑ List of 25–500 influential people in the space, + contact info and an outreach plan

Okay. We'll give this a nice check mark. Next, list of influential people in the space. That could be 25 to even hundreds or thousands of people potentially, plus their contact information and an outreach plan. That outreach plan should include why each target is going to care about the problem, about the solution, and why they're going to share. Why will they amplify?

This is in answer to the question: Who will help amplify this and why? If you don't have a great answer to that, your product launch will almost certainly fall flat from a marketing perspective. If you can build a successful one of these, that list, especially if before you even launch, you know that 20 of these 500 people have said, "Yes, I'm going to amplify. Here's why I care about this. I can't wait until you give me permission to share it or release this thing or send me the version of it." That's an awesome, awesome step.

☑ List of influential publications and media that influencers and target audience members consume

Next, similarly, just like we have a list of influential people, we want a list of influential publications and media that many influencers and many of your target audience members read, watch, subscribe to, listen to, follow, etc. So it's basically these two groups should be paying attention to the media, to the publications that we're trying to list out here. Essentially, that could be events that these people go to. It could be podcasts they listen to. It could be shows they watch, blogs or email newsletters they subscribe to. It could be traditional media, magazines, radio, YouTube channel. Whatever those publications are, all of them are the ones we're trying to build a list of here.

That is going to be part of our outreach target. We might have these influential people, and some of these could overlap. Some of these influential people may work for or at these influential publications and that's fine. I just worry that too much influencer marketing is focused on individuals and not on publications when, in fact, both are critical to a product launch success.

☑ Metrics for success

Metrics, yes, marketers need metrics for success. Those should be in three buckets — exposure and branding, which include things like press and mentions and social engagement, maybe a survey comparison of before and after. We ran an anonymous survey to a group of our target audience before and after and we measured brand awareness differential. Traffic, so links, rankings, visits, time on site, etc., and conversions. That could be measured through last touch or through preferably full-funnel attribution.

☑ Promotional schedule with work items by team member and rollback plan

A promotion schedule. So this means we actually know what we're doing and in what order as the launch rolls out. That could be before launch we're doing a bunch of things around private beta or around sharing with some of these influential people and publications. Or we haven't defined the audience yet. We need to do that. We have that schedule and work items by each team member, and we're going to need a rollback plan. So if at any point along the way, the person who owns the product process says, "This is not good enough," or, "We have a fundamental error," or, "The flamethrower we're building shoots ice instead of fire," we should probably either rename and rebrand it or roll it back. We have that structure set up.

☑ FAQ from the beta/test period, from both potential customers and influencers

Next, frequently asked questions. This is where a beta or test period and test users come in super handy, because they will have asked us a bunch of questions. They'll have asked as they're playing with or observing or using the product. We should be able to take all of those questions from both potential customers and from influencers, and we should have those answers set up for our customer service and help teams and for people who are interfacing with the press and with influencers in case they reach out.

In an ideal world, we would also publish these online. We would have a place where we could reference them. They're already published. This is particularly handy when press and influencers cover a launch and they link to a, "Oh, here's how the ice thrower," I'm assuming, "that we're building is meant to work, and here's at what temperatures it's safe to operate," etc.

☑ Media assets & content for press/influencer use

Next up, media assets and content for those press and publications and influencer use. For example:

  • Videos of people using the product and playing with it
  • Screencasts, screenshots if it's a digital or software product
  • Photos
  • Demo-able versions if you want to give people login access to something special
  • Guidelines for press usage and citations, as well as things like logo and style guide

All of those types of things. Trust me, if your product launch goes well, people will ask you for this, or they will just use things that they steal from your site. You would much prefer to be able to control these assets and to control where the links and citations point, especially from an SEO perspective.

☑ Paid promotion triggers, metrics to watch, and KPIs

Next up, penultimate on our checklist, paid promotion triggers. So most of the time, when you're doing a product launch, there will also be some component that is non-organic, i.e., paid such as paid content. It could be pay-per-click ads. It could be Facebook advertising. It could be web advertising. It could be retargeting and remarketing. It could be broadcast advertising. All of those kinds of things.

You will want with each of those triggers, triggers that essentially say, "Okay, we've reached the point where we are now ready. We executed along our schedule, so we are now ready to turn on the paid promotion, and channel X is going to be the start of that, then channel Y and then channel Z."

Then we should have KPIs, key performance indicators, that tell us whether we're going to grow or shrink that spend, something like this. So we know, hey, the product launch is going this well, so we're going to keep our current level investment. But if we tick up over here, we're going to invest more. If we get to here, we're going to max out our spend. We know that our maximum spend is X. Versus it goes the other way and over here, we're going to cut. We're going to cut all spend if we fall below metric Z.

☑ A great set of answers and 100% alignment on the following statement:

Last but not least on our checklist, this should exist even prior to a product design process. In fact, if you're doing this at the end of a product launch checklist, the rest of this is not going to go so well. But if you start product design with this in mind and then maintain it all the way through launch, through messaging, through all the marketing that you do, you're going to be in good shape. That is a great set of answers and 100% alignment, meaning everyone on the team, who's working on this, agrees that this is how we're going to position this on this statement.

Before the product we're launching existed, our target audience, the group of people up here, was underserved in these ways or by previous solutions or because of these problems. But now, thanks to the thing that we've done, the thing that we've created and what is extraordinary about this product, these problems or this problem is solved.

If you design in this fashion and then you roll out in this fashion, you get this wonderful alignment and connection between how you're branding and marketing the product and how the product was conceived and built. The problem and its solution become clear throughout. That tends to do very, very well for product building and product launching.

All right, everyone, if you have additions to this checklist, I hope you leave them in the comments below. We'll see you again next week for another edition of Whiteboard Friday. Take care.

Video transcription by Speechpad.com


Sign up for The Moz Top 10, a semimonthly mailer updating you on the top ten hottest pieces of SEO news, tips, and rad links uncovered by the Moz team. Think of it as your exclusive digest of stuff you don't have time to hunt down but want to read!

Thursday, April 5, 2018

Climate and Property Rights: A Response to R Street’s Josiah Neeley

Josiah Neeley of the R Street Institute is one of the thought leaders within the small, but vocal segment of the libertarian ecosystem that advocates for a carbon tax, i.e. a fee to be paid into the public coffers per unit of greenhouse gas emitted. R Street and the Niskanen Center argue that the evidence of human-induced global warming is significant enough to constitute a negative externality warranting a state remedy. Neeley’s most recent article addresses a lawsuit brought by an entity calling itself “Our Children’s Trust” that seeks to compel the federal government to “prepare and implement an enforceable national remedial plan to phase out fossil fuel emissions and draw down excess atmospheric CO2.” While Neeley expresses some disagreement with the specific terms of the suit, he lends support to the general principles undergirding it.

Interestingly, Neeley provides a reframing of the issue from that which is typically employed by the more mainstream climate hawks. Instead of focusing on a nebulous “social cost of carbon” and cost-benefit analyses, Neeley frames the issue in terms of property rights, drawing upon the work of Murray Rothbard for intellectual backup. It is a somewhat novel—and, I would argue, far more valid—approach.

Indeed, when addressing issues regarding alleged pollution, property rights are the appropriate lodestar, as Rothbard convincingly argues in “Law, Property Rights, and Air Pollution.” But while Neeley concludes that a focus on property rights should lead to his carbon tax conclusion, I would argue otherwise: neither a focus on property rights nor specifically Rothbard’s perspective does any such thing. In this article I will compare Neeley’s presentation of Rothbard to my reading of Rothbard, highlight the elements of Rothbard’s discussion of air pollution that I think deserve consideration, and relate them to a few of my own thoughts on these issues.

Rather than bolstering Neeley’s case, I think Rothbard’s arguments show the folly of the carbon tax as a response to climate change. What Neeley overlooks in this piece is that a key to the Rothbardian approach to emissions vis-a-vis property rights is evidence of physical invasion. As Rothbard describes:

No action should be considered illicit or illegal unless it invades, or aggresses against, the person or just property of another. Only invasive actions should be declared illegal, and combated with the full power of the law. The invasion must be concrete and physical.

Rothbard was writing before the greenhouse effect became a pressing concern, so we do not know just what he would have said on this issue, but by strictly applying his logic, I submit that he would have disagreed with Neeley’s assessment of greenhouse gases. Greenhouse gases have none of the critical characteristics of the pollutants Rothbard addresses. Whereas a compound emitted by the factory of A, like sulfur dioxide, can infiltrate the property and person of B and adversely affect his respiratory function, greenhouse gases (within the range of real-world emissions) cause no such direct harm. The purported harms from greenhouse gases instead result from the influence of a pooling of gases in the atmosphere over an indefinite period of time on already complex climatologic cycles.

Neeley cites Rothbard’s treatment of radio waves as potential rights violators as if it is ipso facto an indication that Rothbard would take the R Street position on greenhouse gases, but the radio wave example is actually a clear case in illustration of Rothbard’s strict physical application of the invasion principle: writing that hypothetical cancer-causing waves could merit injunction if and only if “proof of harm and the causal connection between the specific invaders and specific victims are established beyond a reasonable doubt.” In the case of the harm described, it is the wave itself that penetrates a person, not a third order consequence. In a related passage Rothbard writes that air pollution “definitely constitutes an invasive interference. These particles can be seen, smelled, or touched, and should therefore constitute invasion per se, except in the case of homesteaded air pollution easements.”

One need not be an expert in climate science to see that this conception of air pollution is narrower than the alleged harms caused by greenhouse gases and, rather than augmenting Neeley’s case, contradicts it.

The pro-carbon tax libertarians have made an interesting habit of drawing upon the standing of deceased thinkers in an attempt to rally support for a tax on energy from advocates of the free market, as we’ve seen with the Niskanen Center’s invocation of Milton Friedman and Friedrich Hayek. Neeley, in this instance, concludes by writing that “the irony for those who consider [R Street] too alarmist on the climate issue is that both our proposal and the Our Children’s Trust lawsuit are actually much easier on greenhouse gas emitters than what hard-line, Rothbardian libertarians would call for.” And yet, Neeley is unable to point to a single, existing hard-line Rothbardian today who truly does call for the government to upend the energy sector. All we have is the occasional writer from R Street or Niskanen confidently telling us that this is what Rothbardians ought to believe, even though the actual Rothbardians alive today say no such thing, to my knowledge.

But the problems with Neeley’s rights-centric argument for climate action go beyond a misapplication of Rothbard and extend to the more important issue of how we should conceive of property rights themselves in the context of emissions.

In addition to the invasion principle, the concepts of particularity and redressability can help us think through the complicated details of emissions, climate, rights, and state action and understand why neither this lawsuit nor a carbon tax makes clear sense from a property perspective.

In accordance with Rothbard’s approach, for state action to be merited either in the form of an injunction (as Neeley thinks Rothbard might handle greenhouse gases) or a tax (as Neeley himself would like) a particular, demonstrable harm to person or property must be proven a strict causal result of the action of another party. In Neeley’s recent article as well as another from 2016, Neeley assumes a far wider definition of what constitute a rights violation than I use or than I interpret Rothbard as using. As Rothbard writes, “a strict causal connection must exist between an aggressor and a victim, and this connection must be provable beyond a reasonable doubt. It must be causality in the commonsense concept of strict proof of the ‘A hit B’ variety, not mere probability or statistical correlation.”

Claims of climate-related damage lack, and will continue to lack, such particularity. Even accepting IPCC climate projections, it is not possible to attribute particular phenomena, such as a river flooding and detrimentally inundating cropland, to climate change as opposed to meteorological variability.

Furthermore, in order for state action to be merited it’s important that such action would serve to remedy the harm in question. Again, assuming IPCC projections, short of an unrealistic drawing of greenhouse gases back out of the atmosphere, there is little the government of this country could do to mitigate the greenhouse effect. While U.S. greenhouse gas emissions have fallen over the last decade, emissions from rapidly-growing Asian countries have continued to climb. The U.S. already contributes less than 15 percent of annual global emissions—and that figure will continue to decline. As a result, even if we take the alleged domestic harms of climate change as given, the question of redress is still left unanswered.

Josiah Neeley properly seeks to reframe our attitude toward climate around the concept of property rights, but in doing so he opens his position to numerous lines of criticism. As Murray Rothbard, whom Neeley sought for theoretical support, describes in “Law, Property Rights, and Air Pollution,” the defense of rights requires more than a claim of harm, but rather a demonstration of evidence of a particular physical impact caused by another party. What’s more, even in the context of a proven rights violation, the challenges of redress must be acknowledged. Contrary to Neeley’s intention, his directing of this debate to the critical concept of rights doesn’t give the state a mandate for action, it invites closer scrutiny.

The post Climate and Property Rights: A Response to R Street’s Josiah Neeley appeared first on IER.

Wednesday, April 4, 2018

Oren Cass Points Out Major Flaw in Climate Change Studies

Oren Cass of the Manhattan Institute has published a fascinating critique of some recent studies that vastly overstate the danger of climate change. In this post I’ll walk through one of his strongest points, where he demonstrates that the studies under review ignore the obvious ability of humans to adapt to a warming climate. Specifically, these studies assume that northern cities in the U.S. won’t be able to deal with “hot days” by the year 2100, as well as southern cities can deal with them right now.

Cass Explains the Technique

Here’s how Cass explains the procedure by which some recent estimates generated enormous human costs due to climate change by the end of the century:

The EPA estimate of costs due to additional heat deaths in 2100 relies on [the study] Mills. Mills studied the effect on mortality rates from days of “extreme” heat (or cold) in 33 cities…

Using climate models, the researchers then estimated for the years 2000 and 2100 a distribution of daily temperatures for each city. In 2000, the climate model’s simulation of Pittsburgh had fewer than five extremely hot days; for 2100, it had approximately 70, each of which Mills assumed would have the elevated mortality level associated with extremely hot days in the past.

Overall, Mills estimated that extreme-heat deaths in the 33 cities studied would rise from fewer than 600 in 2000 to more than 7,500 in 2100, even if their populations remained constant.

EPA employed the Mills methodology but used a different climate model…and accounted for population growth over the century. In the EPA model, Pittsburgh’s annual death rate from extreme temperatures increases 30-fold, from 0.4 per 100,000 people in 2000 to 12.8 in 2100. Across all cities, excess fatalities by 2100 would exceed 12,000. [Cass p. 7, endnotes removed.]

To paraphrase, the EPA’s estimate of (some of) the costs of climate change first calculated how many people died in cities like Pittsburgh on extremely hot days, which occurred only a handful of times in the year 2000. Then, using computer simulations of climate change, the number of extremely hot days in the year 2100 was expected to rise to around 70. It was assumed that the impact of such days on fatalities would be the same in 2100 as it was in 2000, but since there would be so many more such days, the mortality rate exploded.

The Flaw

The tremendous flaw with this method, of course, is that it assumes humans will not adapt to the warmer climate, even though they have eight decades to do so (and will be far richer in 2100 than we are now). But it is well known that if, say, someone moves from the north down south, that his or her body eventually adjusts. Beyond this physiological adaptation, there are obvious changes in building design and work routines that could reduce mortality rates from extreme heat.

This isn’t speculation. Oren Cass provides the following, absolutely devastating argument against the absurdly high predictions coming from these particular studies:


To repeat, the alarmist estimates of “damages from climate change” are driven by predictions that northern cities will suffer huge increases in heat mortality by the year 2100. Yet as Cass’ Figure 2 shows, these warnings assume that northern cities in the year 2100 will have mortality rates from “extremely hot days” that are forty to seventy-five times as high as what southern cities experienced in the year 2000.

A Snow Analogy

It might be difficult for the reader to understand just how silly this is, so let’s use an analogy. (Cass himself used the same one.) People from up north are used to driving in the snow: They know how to handle their vehicles better, and the authorities have more plows, salting trucks, etc. to deal with a major storm. Consequently, if a snowstorm of a given magnitude hits a city like Boston, it doesn’t cause nearly as many fatalities as if the same storm were to hit Atlanta.

But suppose that over the course of decades, people living in Atlanta got hit with as much snow during a typical year as Boston experiences right now. In that case, the people of Atlanta would begin to exhibit Bostonians’ resilience in the face of Mother Nature. They too would learn how to drive better in the snow, and the local governments would buy the appropriate equipment to keep the roads operable. It would be foolish to look at the spike in traffic fatalities in Atlanta during the worst snowstorm it got in the year 2000, and assume the experience would stay the same even if Atlanta got hit with 70 such storms during the year.

Conclusion

Oren Cass’ new paper shows how several recent studies have grossly exaggerated the potential harms from climate change. In this blog post, I outlined one of the most obvious problems in the techniques used. Specifically, these studies looked at extreme weather events in the past, and assumed that even if such events became commonplace by the year 2100, that humans would be unable to adapt and reduce their vulnerability during the 80 years in between.

Cass’ paper has many other excellent points. I encourage those interested in the climate change policy debate to read it in its entirety.

The post Oren Cass Points Out Major Flaw in Climate Change Studies appeared first on IER.

How to Make Effective, High-Quality Marketing Reports & Dashboards

Posted by Dom-Woodman

My current obsession has been reporting. Everyone could benefit from paying more attention to it. Five years, countless ciders, and too many conferences into my career, I finally spent some time on it.

Bad reporting soaks up just as much time as pointless meetings. Analysts spend hours creating reports that no one will read, or making dashboards that never get looked it. Bad reporting means people either focus on the wrong goals, or they pick the right goals, but choose the wrong way to measure them. Either way, you end up in the same place.

So I thought I'd share what I’ve learned.

We’re going to split this into:

  • Definitions
  • What is the goal of a report and a dashboard? (And how are they different?)
  • Who is the data for?
  • How to create a good dashboard
  • How to create a good report
  • How to create useful graphs
  • Useful tools

(We’ll lean on SEO examples — we’re on Moz! — however, for those non-SEO folks, the principles are the same.)

What is the goal of a report versus a dashboard?

Dashboards

Dashboards should:

  • Measure a goal(s) over time
  • Be easily digestible at a glance

The action you take off a dashboard should be:

  • Let’s go look into this.

Example questions a dashboard would answer:

  • How are we performing organically?
  • How fast does our site load?

Reports

Reports should:

  • Help you make a decision

The action you take off a report should be:

  • Making a decision

Example questions a report would answer:

  • Are our product changes hurting organic search?
  • What are the biggest elements slowing our website?

Who is this data for?

This context will inform many of our decisions. We care about our audience, because they all know and care about very different things.

A C-level executive doesn’t care about keyword cannibalization, but probably does care about the overall performance of marketing. An SEO manager, on the other hand, probably does care about the number of pages indexed and keyword cannibalization, but is less bothered by the overall performance of marketing.

Don’t mix audience levels

If someone tells you the report is for audiences with obviously different decision levels, then you’re almost always going to end up creating something that won’t fulfill the goals we talked about above. Split up your reporting into individual reports/dashboards for each audience, or it will be left ignored and unloved.

Find out what your audience cares about

How do you know what your audience will care about? Ask them. As a rough guide, you can assume people typically care about:

  • The goals that their jobs depend on. If your SEO manager is being paid because the business wants to rank for ten specific keywords, then they’re unlikely to care about much else.
  • Budget or people they have control over.

But seriously. Ask them what they care about.

Educating your audience

Asking them is particularly important, because you don’t just need to understand your audience — you may also need to educate them. To go back on myself, there are in fact CEOs who will care about specific keywords.

The problem is, they shouldn’t. And if you can’t convince them to stop caring about that metric, their incentives will be wrong and succeeding in search will be harder. So ask. Persuading them to stop using the wrong metrics is, of course, another article in and of itself.

Get agreement now

To continue that point, now is also the time to get initial agreement that these dashboards/reports will be what’s used to measure performance.

That way, when they email you three months in asking how you’re doing for keyword x, you’re covered.

How to create a good dashboard

Picking a sensible goal for your dashboard

The question you’re answering with a dashboard is usually quite simple. It's often some version of:

  • Are we being successful at x?

...where x is a general goal, not a metric. The difference here is that a goal is the end result (e.g. a fast website), and the metric (e.g. time to start render) is the way of measuring progress against that.

How to choose good metrics for dashboards

This is the hard part. We’re defining our goal by the metrics we choose to measure it by.

A good metric is typically a direct measure of success. It should ideally have no caveats that are outside your control.

No caveats? Ask yourself how you would explain if the number went down. If you can immediately come up with excuses that could be answered by things out of your control, then you should try to refine this metric. (Don’t worry, there's an example in the next section.)

We also need to be sure that it will create incentives for how people behave.

Unlike a report, which will be used to help us make a decision, a dashboard is showing the goals we care about. It’s a subtle distinction, but an important one. A report will help you make a single decision. A dashboard and the KPIs it shows will define the decisions and reports you create and the ideas people have. It will set incentives and change how the people working off it behave. Choose carefully. Avinash has my back here; go read his excellent article on choosing KPIs.

You need to bear both of these in mind when choosing metrics. You typically want only one or two metrics per goal to avoid being overwhelming.

Example: Building the spec for our dashboard

Goal: Measure the success of organic performance

Who is it for: SEO manager

The goal we’re measuring and the target audience are sane, so now we need to pick a metric.

We’ll start with a common metric that I often hear suggested and we’ll iterate on it until we’re happy. Our starting place is:

  1. Metric: Search/SEO visibility
    1. “Our search visibility has dropped”: This could be because we were ranking for vanity terms like Facebook and we lost that ranking. Our traffic would be fine, but our visibility would be down. *Not a good metric.
  2. Metric: Organic sessions over time
    1. “Our organic sessions have dropped”: This could easily be because of seasonality. We always see a drop in the summer holidays. *Okay, also not a good metric.
  3. Metric: Organic sessions with smoothed seasonality
    1. Aside: See a good example of this here.
    2. “Our organic sessions with smoothed seasonality have dropped”: What if the industry is in a downturn? *We’re getting somewhere here. But let’s just see...
  4. Metric: Organic sessions with smoothed seasonality and adjusted for industry
    1. “Our organic sessions with smoothed seasonality and adjusted for industry have dropped”: *Now we’ve got a metric that’s getting quite robust. If this number drops, we’re going to care about it.

You might have to compromise your metric depending on resources. What we’ve just talked through is an ideal. Adjusting for industry, for example, is typically quite hard; you might have to settle for showing Google trends for some popular terms on a second graph, or showing Hitwise industry data on another graph.

Watch out if you find yourself adding more than one or two additional metrics. When you get to three or four, information gets difficult to parse at glance.

What about incentives? The metric we settled on will incentivize our team get more traffic, but it doesn’t have any quality control.

We could succeed at our goal by aiming for low-quality traffic, which doesn’t convert or care about our brand. We should consider adding a second metric, perhaps revenue attributed to search with linear attribution, smoothed seasonality, and a 90-day lookback. Or alternatively, organic non-bounce sessions with smoothed seasonality (using adjusted bounce rate).

Both those metrics sound like a bit of a mouthful. That’s because they’ve gone through a process similar to what we talked about above. We might’ve started with revenue attributed to search before, then got more specific and ended up with revenue attributed to search with linear attribution, smoothed seasonality and a 90-day lookback.

Remember, a dashboard shouldn’t try to explain why performance was bad (based on things in your control). A dashboard's job is to track a goal over time and says whether or not further investigation is needed.

Laying out and styling dashboards

The goal here is to convey our information as quickly and easily as possible. It should be eyeball-able.

Creating a good dashboard layout:

  • It should all fit on a single screen (i.e. don’t scroll on the standard screen that will show the results)
  • People typically read from the top and left. Work out the importance of each graph to the question you’re answering and order them accordingly.
  • The question a graph is answering should be sat near it (usually above it)
  • Your design should keep the focus on the content. Simplify: keep styles and colors unified, where possible.

Here’s a really basic example I mocked up for this post, based on the section above:

  • We picked two crucial summary metrics for organic traffic:
    1. Organic sessions with smoothed seasonality
      • In this case we’ve done a really basic version of “adjusting” for seasonality by just showing year on year!
    2. Revenue attributed to organic sessions
  • We’ve kept the colors clean and unified.
  • We’ve got clean labels and, based on imaginary discussions, we’ve decided to put organic sessions above attributed revenue.

(The sharp-eyed amongst you may notice a small bug. The dates in the x-axis are misaligned by 1 day; this was due to some temporary constraints on my end. Don’t repeat this in your actual report!)

How to create a good report

Picking a sensible decision for your report

A report needs to be able to help us make a decision. Picking the goal for a dashboard is typically quite simple. Choosing the decision our report is helping us make is usually a little more fraught. Most importantly, we need to decide:

  • Is there a decision to be made or are we knowledge-gathering for its own sake?

If you don’t have a decision in mind, if you’re just creating a report to dig into things, then you’re wasting time. Don’t make a report.

If the decision is to prioritize next month, then you could have an investigative report designed to help you prioritize. But the goal of the report isn’t to dig in — it's to help you make a decision. This is primarily a frame of mind, but I think it’s a crucial one.

Once we’ve settled on the decision, we then:

  • Make a list of all the data that might be relevant to this decision
  • Work down the list and ask the following question for each factor:
    1. What are the odds this piece of information causes me to change my mind?
    2. Could this information be better segmented or grouped to improve?
    3. How long will it take me to add this information to the report?
    4. Is this information for ruling something out or helping me weigh a decision?

Example: Creating a spec for a report

Here’s an example decision a client suggested to me recently:

  • Decision: Do we need to change our focus based on our weekly organic traffic fluctuations?
  • Who’s it for: SEO manager
  • Website: A large e-commerce site

Are we happy with this decision? In this case, I wasn’t. Experience has taught me that SEO very rarely runs week to week; one thing our SEO split-testing platform has taught us time and time again is even obvious improvements can take three to four weeks to result in significant traffic change.

  • New decision: Do we need to change our focus based on our monthly organic traffic fluctuations?

Great — we’re now happy with our decision, so let’s start listing possible factors. For the sake of brevity, I’m only going to include three here:

  • Individual keyword rankings
  • Individual keyword clicks
  • Number of indexed pages

1. Individual keyword rankings

  • What are the odds this piece of information causes me to change my mind?
    • As individual keyword rankings? Pretty low. This is a large website and individual keyword fluctuations aren’t much use; it will take too long to look through and I’ll probably end up ignoring it.
  • Could this information be better segmented or grouped to improve?
    • Yes, absolutely. If we were to group this by page type or topic level, it becomes far more interesting. Knowing my traffic has dropped only for one topic would make me want to go to push more resources to try and bring us back to parity. We would ideally also want to see the difference in rank with and without features.
  • How long will it take me to add this information to the report?
    • There are plenty of rank trackers with this data. It might take some integration time, but the data exists.
  • Is this information for ruling something out or helping me weigh a decision?
    • We’re just generically looking at performance here, so this is helping me weigh up my decision.

Conclusion: Yes, we should include keyword rankings, but they need to be grouped and ideally also have both rank with and without Google features. We’ll also want to avoid averaging rank, to lose subtlety in how our keywords are moving amongst each other. This example graph from STAT illustrates this well:

2. Individual keyword clicks

  • What are the odds this piece of information causes me to change my mind?
    • Low. Particularly because it won’t compensate for seasonality, I would definitely find myself relying more on rank here.
  • Could this information be better segmented or grouped to improve?
    • Again yes, same as above. It would almost certainly need to be grouped.
  • How long will it take me to add this information to the report?
    • This will have to come from Search Console. There will be some integration time again, but the data exists.
  • Is this information for ruling something out or helping me weigh a decision?
    • Again, we’re just generically looking at performance here, so this is helping me weigh up my decision.

Conclusion: I would probably say no. We’re only looking at organic performance here and clicks will be subject to seasonality and industry trends that aren’t related to our organic performance. There are certainly click metrics that will be useful that we haven’t gone over in these examples — this just isn’t one of them.

3. Number of indexed pages

  • What are the odds this piece of information causes me to change my mind?
    • Low, although sharp jumps would definitely be cause for further investigation.
  • Could this information be better segmented or grouped to improve?
    • It could sometimes be broken down into individual sections, using Search Console folders.
  • How long will it take me to add this information to the report?
    • This will have to come from Search Console. It doesn’t exist in the API, however, and will be a hassle to add or will have to be done manually.
  • Is this information for ruling something out or helping me weigh a decision?
    • This is just ruling out, as it's possible any changes in fluctuation have come from massive index bloat.

Conclusion: Probably yes. The automation will be a pain, but it will be relatively easy to pull it in manually once a month. It won’t change anyone's mind very often, so it won’t be put at the forefront of a report, but it’s a useful additional piece of information that’s very quick to scan and will help us rule something out.

Laying out and styling reports

Again, our layout should be fit for the goal we’re trying to achieve, which gives us a couple principles to follow:

  • It’s completely fine for reports to be large, as long as they’re ordered by the odds that the decision will change someone's mind. Complexity is fine as long as it’s accompanied by depth and you don’t get it all at once.
  • On a similar point, you’ll often have to breakdown metrics into multiple graphs. Make sure that you order them by importance so someone can stop digging whenever they’re happy.

Here’s an example from an internal report I made. It shows the page breakdown first and then the page keyword breakdown after it to let you dig deeper.

  • There’s nothing wrong with repeating graphs. If you have a summary page with five following pages, each of which picks one crucial metric from the summary and digs deeper, it's absolutely useful to repeat the summary graph for that metric at the top.
  • Pick a reporting program which allows paged information, like Google Data Studio, for example. It will force you to break a report into chunks.
  • As with dashboards, your design should keep the focus on the content. Simplify — keep styles and colors unified where possible.

Creating an effective graph

The graphs themselves are crucial elements of a report and dashboard. People have built entire careers out of helping people visualize data on graphs. Rather than reinvent the wheel, the following resources have all helped me avoid the worst when it comes to graphs.

Both #1 and #2 below don’t focus on making things pretty, but rather on the goal of a graph: to let you process data as quickly as possible.

  1. Do’s and Don’ts for Effective Graphs
  2. Karl Broman on How to Display Data Badly
  3. Dark Horse Analytics - Data Looks Better Naked
  4. Additional geek resource: Creating 538-Style Charts with matplotlib

Sometimes (read: nearly always) you’ll be limited by the programs you work in, but it’s good to know the ideal, even if you can’t quite reach it.

What did we learn?

Well, we got to the end of the article and I’ve barely even touched on how to practically make dashboards/reports. Where are the screenshots of the Google Data Studio menus and the step-by-step walkthroughs? Where’s the list of tools? Where’s the explanation on how to use a Google Sheet as a temporary database?

Those are all great questions, but it’s not where the problem lies.

We need to spend more time thinking about the content of reports and what they're being used for. It’s possible having read this article you’ll come away with the determination to make fewer reports and to trash a whole bunch of your dashboards.

That’s fantastic. Mission accomplished.

There are good tools out there (I quite like Plot.ly and Google Data Studio) which make generating graphs easier, but the problem with many of the dashboards and reports I see isn’t that they’ve used the Excel default colors — it’s that they haven’t spent enough time thinking about the decision the report makes, or picking the ideal metric for a dashboard.

Let’s go out and think more about our reports and dashboards before we even begin making them.

What do you guys think? Has this been other people's experience? What are the best/worst reports and dashboards you’ve seen and why?


Sign up for The Moz Top 10, a semimonthly mailer updating you on the top ten hottest pieces of SEO news, tips, and rad links uncovered by the Moz team. Think of it as your exclusive digest of stuff you don't have time to hunt down but want to read!

Tuesday, April 3, 2018

The Guide to Local Sponsorship Marketing - The 2018 Edition

Posted by Claudia0428

For most Moz readers, local marketing means content, reviews, AdWords, local listings, and of course citations. If you’re a larger brand, you might be doing outdoor, radio, print, and television advertising as well. Today we’re here to humbly submit that local sponsorships remain the most-overlooked and opportunity-rich channel, and they build real local connections for both large brands and small business alike.

This article is the second edition of the ZipSprout team’s guide to local sponsorships. We wrote the first edition in 2016 after a few months of securing local sponsorship campaigns for a handful of clients. Since then, we’ve tripled our client roster and we’ve worked with more than 8,000 local organizations, donating nearly $1,000,000 in local sponsorships to 1,300+ opportunities. Since then we’ve also learned how to build campaigns for local presence.

So we knew the guide was due for a reboot.

One of our most significant learnings of the past two years is the understanding of local sponsorships as a channel in their own right. They can be directed toward local SEO or local marketing campaigns, but sponsorships are their own breed of local connection — and just like content campaigns, local PR campaigns, or review management, local sponsorships have their own set of conventions and best practices.

This article is meant for anyone with an eye toward local sponsorships as a marketing channel. Agencies and enterprise organizations may find it particularly helpful, but we’re big believers in encouraging smaller local businesses to engage in sponsorships too. Get out there and meet your neighbors!


The what & why of local sponsorships

Local events, nonprofits, and associations constitute a disjointed but very real network of opportunities. Unlike other channels, local sponsorships aren’t accessible from a single platform, but we’ve found that many sponsorships share similarities. This makes it possible to develop processes that work for campaigns in any metro area.

Local sponsorships are also a unique channel in that the benefits can range from the digital to the analog: from local links to a booth, from social posts to signage on a soccer field. The common thread is joining the community by partnering with local organizations, but the benefits themselves vary widely.

We’ve identified and track 24 unique benefits of sponsorships related to local marketing:

  1. Ad (full or partial)
  2. Advertising on event app
  3. Blog post featuring sponsor
  4. Booth, tent, or table at event
  5. Event named for sponsor
  6. Guest post on organization blog
  7. Inclusion in press release
  8. Link in email newsletter
  9. Link on website
  10. Logo on event t-shirt or other swag
  11. Logo on signage
  12. Logo or name on website
  13. Media spots (television/radio/newspaper)
  14. Mention in email newsletter
  15. Mention in publicity materials, such as programs & other printed materials
  16. Networking opportunity
  17. Physical thing (building, etc.) named for sponsor
  18. Social media mention
  19. Speaking opportunity at event
  20. Sponsor & sponsor's employees receive discounts on services/products/events
  21. Sponsor can donate merchandise for goodie bags
  22. Sponsored post (on blog or online magazine)
  23. Tickets to event
  24. Verbal recognition

There are probably more, but in our experience most benefits fall into these core categories. That said, these benefits aren’t necessarily for everyone...

Who shouldn’t do local sponsorships?

1. Don’t do local sponsorships if you need fast turnaround.

Campaigns can take 1–3 months from launch until fulfillment. If you’re in a hurry to see a return, just increase your search ad budget.

2. Don’t do local sponsorships if you’re not okay with the branding component.

Local link building can certainly be measured, as can coupon usage, email addresses gathered for a drawing, etc… But measuring local brand lift still isn’t a perfect art form. Leave pure attribution to digital ads.

3. Don’t do local sponsorships with a "one size fits all" expectation.

The great thing about local events and opportunities is their diversity. While some components can be scaled, others require high touch outreach, more similar to a PR campaign.

Considerations for agencies vs brands in local sponsorship campaigns

Agencies, especially if they’re creating sponsorship campaigns for multiple clients, can cast a wide net and select from the best opportunities that return. Even if a potential partnership isn’t a good fit for a current client, they may work for a client down the road. Brands, on the other hand, need to be a little more goal and mission-focused during prospecting and outreach. If they’re reaching out to organizations that are clearly a bad fit, they’re wasting everyone’s time.

Brands also need to be more careful because they have a consumer-facing image to protect. As with any outreach campaign, there are dos and don’ts and best practices that all should follow (DO be respectful; DON’T over-email), but brands especially have more to lose from an outreach faux pas.


Our process

Outreach

Once we’ve identified local organizations in a given metro area, we recommend reaching out with an email to introduce ourselves and learn more about sponsorship opportunities. In two years, the ZipSprout team has A/B tested 100 different email templates.

With these initial emails, we’re trying to inform without confusing or scaring away potential new partners. Some templates have resulted in local organizations thinking we’re asking them for sponsorship money or that we want to charge them for a service. Oops! A/B tests have helped to find the best wording for clarity and, in turn, response rate.

Here are some of our learnings:

1. Mentioning location matters.

We reached out to almost 1,000 Chicago organizations in the spring of 2017. When we mentioned Chicago in the email, the response rate increased by 20%.

2. Emails sent to organizations who already had sponsorship info on their websites were most successful if the email acknowledged the onsite sponsorship info and asked for confirmation.

These are also our most successful outreach attempts, likely because these organizations are actively looking for sponsors (as signified by having sponsorship info on their site). Further, by demonstrating that we’ve been on their site, we’re signaling a higher level of intent.

3. Whether or not we included an outreacher phone number in email signatures had no effect on response rate.

If anything, response rates were higher for emails with no phone number in signature, at 41% compared with 40.2%.

4. Shorter is better when it comes to outreach emails.

Consider the following two emails:

EMAIL A

Hi [NAME],

I sent an email last week, but in case you missed it, I figured I’d follow up. :)

I work to help corporate clients find local sponsorships. We’re an agency that helps our business clients identify and sponsor local organizations like [ORG NAME]. We’re paid by businesses who are looking for local sponsorships.

Often, local organizations are overlooked, so my company, ZipSprout, works for businesses who want to sponsor locally, but aren’t sure who to partner with. To that end, I'd love to learn more about [ORG NAME] and see what sponsorship opportunities you have available. Is there a PDF or list of cost and benefits you can share over email or a phone call?

Thanks,
___
EMAIL B

Hi [NAME],

I sent an email last week, but in case you missed it, I figured I’d follow up. :)

I'd love to learn more about [ORG NAME] and see what sponsorships you have available. Is there a PDF or list of cost and benefits you can share over email or a phone call?

Thanks,
___

In an 800-email test, Email B performed 30% better than Email A.

Matchmaking: How can I choose a sponsorship opportunity that fits my brand?

There are many ways to evaluate potential sponsorships.

These are the questions that help us match organizations with clients:

  • Who is your brand targeting (women, senior citizens, family-friendly, dog owners, new parents)?
  • Do you want to tie your brand with a particular cause (eco-friendly, professional associations, awareness foundations, advocacy groups)?
  • Is your campaign based on location? Are you launching your brand in a particular city? A particular zip code?
  • What is your total budget and per-sponsorship range? A top max price or a price range is a useful parameter — and perhaps the most important.

Once the campaign goals are determined, we filter through opportunities based partially on their online presence. We look at Domain Authority, location, website aesthetics, and other sponsors (competitors and non-competitors) in addition to Reach Score (details below).

Further, we review backlinks, organic traffic, and referring domains. We make sure that this nonprofit partnership is not spammy or funky from an SEO perspective and that is a frequently visited website. A small organization may not have all the juicy digital metrics, but by gauging event attendance or measuring organic traffic we can further identify solid prospects that could have been missed otherwise.

We also look at social media presence; event attendance, event dates and how responsive these organizations or event organizers are. Responsiveness, we have learned, is a CRITICAL variable. It can be the determining point of your link going live in 48 hours or less, as opposed to 6+ months from payment.

Reach Score

From a numbers perspective, Domain Authority is a good way to appreciate the value of a website, but it doesn’t tell the whole story when it comes to local marketing. To help fill in the gaps we created Reach Score, which combines virtual measures (like Domain Authority) with social measures (friends/followers) and physical measures (event attendance). The score ranks entities based on their metro area, so we’re not comparing the reach of an organization in Louisville, KY to one in NYC.

As of March 2018, we have about 8,000 organizations with valid Reach Scores across four metro areas — Raleigh/Durham, Boston, Houston, and Chicago. The average Reach Score is 37 out of 100. Of the 34 types of organizations that we track, the most common is Event Venue/Company (average Reach Score of 38), followed by Advocacy Groups (43) and Sports Teams/Clubs/Leagues (22). The types of organizations with the highest Reach Scores are Local Government (64), Museums (63), and Parks and Recreation (55).

Thanks to Reach Score, we’ve found differences between organizations from city to city as well. In Raleigh-Durham, the entities with the highest reach tend to be government-related organizations, such as Chambers of Commerce and Parks & Rec Departments.

In Boston, the highest reach tends to fall to arts organizations, such as music ensembles, as well as professional associations. This score serves as a good reminder that each metro area has a unique community of local organizations. (Read more about our Reach Score findings here.)

Fulfillment

Our campaigns used to take several months to complete, from contract to final sponsorship. Now our average fulfillment rate is 18.7 days, regardless of our project size! Staying (politely) on top of the communication with the nonprofit organizations was the main driver for this improvement.

We find further that the first 48 hours from sending a notification of sponsorship on behalf of your brand are crucial to speedy campaigns. Be ready to award the sponsorship funds in a timely manner and follow up with a phone call or an email, checking in to see if these funds have been received.

It's okay to ask when can you expect the sponsorship digital benefits to go live and how to streamline the process for any other deliverables needed to complete the sponsorship.

Applying these simple best practices, our team has been able to run a campaign in a week or less.

Two important concepts to remember about the sponsorship channel from the fulfillment perspective:

  1. It’s difficult to fulfill. If your city project involves any more than two or three sponsorships, you're in for multiple hours of follow ups, reminders, phone calls, etc. There is the desire from most local organizations to honor their sponsors and keep them happy. That said, we've learned that keeping the momentum going serves as an important reminder for the nonprofit. This can involve phone call reminders and emails for links to go live and other benefits to come through. Again, be polite and respectful.
  2. It’s SO worth all the effort though! It shows that your brand cares. A sponsorship campaign is a fantastic way to get in front of your target audience in areas that have a special meaning at a personal level. And not in a broad general scope, but locally. Locally sponsoring a beach cleanup in Santa Monica gives you the opportunity to impact a highly localized audience with a very particular cause in mind that would ultimately affect their everyday life, as opposed to partnering with a huge foundation advocating for clean oceans.

Enhancing a local campaign

Some prefer to use local sponsorships as a link building effort, but there are ways — and ample benefit — to going far beyond the link.

Local event attendance

So, so many local sponsorship campaigns come with the opportunity for event attendance. We currently have 11,345 opportunities in our database (62.2% of our total inventory) that feature events: 5Ks, galas, performances, parades, and even a rubber ducky derby or two! If you’re able to send local team members, find opportunities that match your target audience and test it out — and bring your camera so your social and brand team will have material for publication. If local team members aren’t an option, consider working with a notable and ambitious startup such as Field Day, which can send locals out on behalf of your brand. We’ve spoken with them on several occasions and found them adaptable and wonderful to work with.

Coupons/invitations

One client, FunBrands, used local sponsorships as a way to reach out to locals ahead of stores’ grand re-openings (read the full case study here).

For another client, we created unique coupons for each local organization, using print and social media posts for distribution.

An example coupon — use codes to track attribution back to an event.


Conclusion: Local sponsorships are a channel

Sponsorships are an actionable strategy that contribute to your local rankings, while providing unprecedented opportunities for community engagement and neighborly branding. We hope that this updated guide will provide a strong operational overview along with realistic expectations — and even inspirations — for a local sponsorship campaign in your target cities.

Last but not least: As with all outreach campaigns, please remember to be human. Keep in mind that local engagements are the living extension of your brand in the real world. And if somehow this article wasn’t enough, we just finished up The Local Sponsorship Playbook. Every purchase comes with a 30-minute consultation with the author. We hope everyone chooses to get out, get local, and join the community in the channel that truly benefits everyone.


Sign up for The Moz Top 10, a semimonthly mailer updating you on the top ten hottest pieces of SEO news, tips, and rad links uncovered by the Moz team. Think of it as your exclusive digest of stuff you don't have time to hunt down but want to read!

Monday, April 2, 2018

Global Fossil Fuel Consumption Subsidies Abound, But Not in the United States

The International Energy Agency (IEA) annually estimates global fossil-fuel consumption subsidies that measure what many developing countries spend to provide below-market cost fuel to their citizens. In 2016, IEA found that fossil fuel consumption subsidies totaled around $260 billion, 16 percent lower (about $50 billion less) than in 2015. According to IEA, this decrease is partly due to lower international energy prices of subsidized fuels. Oil subsidies made up 40 percent of the total fossil fuel consumption subsidies, while electricity made up 41 percent, natural gas 19 percent and coal 0.8 percent. According to the IEA, the United States does not have any consumption subsidies for oil, coal, electricity or natural gas.

The IEA is a part of the Organization for Economic Cooperation and Development (OECD), which represents the developed nations of the world. IEA’s subsidy study found that many developing countries artificially lower energy prices to their citizens, paying the difference from their government resources. These wealth transfers are differentiable from subsidies that are intended to support uneconomic energy sources such as wind and solar technologies toward commercialization. The United States and other developed countries support energy production of all types in the form of tax credits, loan guarantees or mandates, which are not included in IEA’s fossil fuel consumption subsidy calculations since they are directed towards production rather than consumption of the fuel.

Source: International Energy Agency, Energy Subsidies, IEA

Fossil Fuel Consumption Subsidies by Country

China leads the world in fossil fuel consumption subsidies providing $36 billion from its government resources in 2016 to lower the cost of fossil fuels to end-users in its country.  Of the $36 billion in fossil fuel consumption subsidies China paid, 34 percent covered oil and 66 percent went to electricity. Iran is the second largest country subsidizing end-use fossil fuel prices, providing 46 percent of its $34.8 billion in fossil fuel consumption subsidies to oil, 14 percent to electricity, and 40 percent to natural gas. Saudi Arabia ranked third with $29.7 billion in fossil fuel consumption subsidies, 65 percent covering oil, 12 percent covering natural gas and 23 percent going to electricity. Russia came in fourth with $28.2 billion in fossil fuel consumption subsidies–electricity garnered 66 percent, and natural gas 34 percent. Venezuela ranked fifth with fossil fuel consumption subsidies totaling $16.1 billion, 74 percent covering oil, 9 percent covering natural gas and 17 percent covering electricity.

Indonesia and India ranked sixth and seventh, respectively, both funding at least $13 billion in fossil fuel consumption subsidies.  Indonesia’s fossil fuel consumption subsidies totaled $15.6 billion in 2016 with oil receiving 28 percent and electricity, 72 percent. India’s fossil fuel consumption subsidies totaled $13.4 billion in 2016; the distribution of India’s fossil fuel consumption subsidies was:  77 percent oil, 6 percent natural gas, and 18 percent electricity. Egypt, Algeria and Mexico ranked eighth, ninth and tenth in fossil fuel consumption subsidies, respectively, with subsidies totaling $11.1 billion (Egypt), $0.97 billion (Algeria) and $0.93 billion (Mexico).

Coal received almost $2 billion in fossil fuel consumption subsidies, just 0.8 percent of the total. The countries that subsidized coal in 2016 were Kazakhstan, Vietnam, Argentina and Korea.

Many of the countries providing fossil fuel consumption subsidies own state energy companies, including countries that comprise the Organization of Petroleum Exporting Countries, such as Iran, Saudi Arabia, and Venezuela. Net exporting countries see these subsidies as an opportunity cost that benefits their citizens by providing lower cost transportation fuels and reducing other energy costs.

Developed countries, such as the United States, do not have fossil fuel consumption subsidies, as seen in the following chart.

Energy Consumption Subsidies by Country, 2016 (Million USD)

Source: International Energy Agency, Energy Subsidies, IEA

Energy Consumption Subsidies were Intended to Alleviate Poverty

Fossil fuel consumption subsidies are often used by developing countries to alleviate energy poverty, but are an inefficient means for doing so, creating market distortions that result in wasteful energy consumption. As such, there is political pressure to remove fossil fuel consumption subsidies. In 2016, the G20 leaders reaffirmed an earlier pledge to phase them out.

Their reaffirmation is backed up by studies that show that fossil fuel consumption subsidies are a poor means of alleviating poverty. An IMF study of 20 developing countries showed the poorest fifth of the population received on average 7 percent of the overall subsidy benefit, and the richest fifth received almost 43 percent. Another study looking at India found that, of the $22.5 billion spent on fossil fuel subsidies in 2010, less than $2 billion benefited the poorest 20 percent because poorer households in poor countries use less fuel than wealthier households, even when energy is subsidized.

Subsidies can also lead to energy shortages. In Myanmar, fixed prices for electricity, diesel and petrol resulted in shortages when those prices fell below international market levels because suppliers exported to China and Thailand rather than supplying domestic use. It also deprived the country of revenues needed for infrastructure.

An article in Nature shows that, if fossil fuel subsidies were removed worldwide, emissions reductions would occur primarily in oil and gas exporting regions: Russia, the Middle East, North Africa and Latin America. Most subsidies originate in these regions, but they also benefit fewer people living below the poverty line than in lower income countries such as India.

A way to reduce or remove energy consumption subsidies is to combine them with effective pro-poor policies. Examples include India paying for cooking gas for those households which fall below a certain income level, or reallocating the energy subsidy money for other uses. In India’s case, subsidized liquid petroleum gas (propane) replaced open wood–and even dung–fires for cooking, thus reducing adverse health effects. In Indonesia, it was used to help finance infrastructure development, and in Iran it was used for universal health care.

Conclusion                                                                                                                            

Many Americans are confused by the large amount of global fossil fuel consumption subsidies that the IEA calculates, not realizing that these subsidies have nothing to do with tax policy, research and development or loan guarantees, where most U.S. programs are directed. In fact, most liberalized countries do not offer fossil fuel consumption subsidies that artificially lower the end-use price of the fuel. Fossil fuel consumption subsidies are common and even pervasive in the developing world, particularly in economies with state-owned energy companies. The IEA has been advocating for years that fossil fuel consumption subsidies should be eliminated since they encourage wasteful consumption.

Fossil fuel consumption subsidies in developing countries are welfare transfers that can be differentiated from subsidies in the name of commercializing or sustaining uneconomic energy sources such as on-grid wind or solar, which the United States and other industrialized countries have been subsidizing and/or mandating. These latter forms of energy subsidies that help promote production of uneconomic energy sources can be abolished without detrimental effects to the U.S. economy or its citizens. In fact, they would increase economic efficiency since by their very nature, they are generally more expensive than competing forms of energy.

The OECD countries find fault with developing countries for subsidizing the costs of energy purchased by their citizens, but those same OECD nations are busy subsidizing and mandating the use of uneconomic and inefficient forms of energy which will make energy more expensive and less reliable for their citizens.  The economies would be better off if all such supports by governments were abolished.

The post Global Fossil Fuel Consumption Subsidies Abound, But Not in the United States appeared first on IER.