Tuesday, January 31, 2017

SEI and WISE Team Up to Empower Women Through Solar Training Partnership

“Solar Energy International (SEI) is thrilled to announce our expanded partnership with WISE – Women in Solar Energy, encouraging even more women to enter the solar industry. Since SEI’s founding in 1991, they have empowered women to enter the renewable energy  workforce through scholarships, women’s-only trainings, and by the incredible women that teach and work for SEI. By partnering with WISE, our alumni will have access to WISE’s expansive networking opportunities for women to interact with and receive support from other women in the industry. The SEI/WISE partnership leverages what each organization does best and women, whether new to the industry or pioneers, benefit!” Kathy Swartz, SEI Executive Director

Together, WISE and SEI are working to train and empower more women in the solar energy workforce. This partnership will support SEI’s historical outreach efforts to women in the industry and provides discounted training opportunities to WISE’s membership base. All eligible SEI Alumni will be granted membership to WISE at no extra cost, an incredible opportunity for Alumni to connect with an established network of women working in the solar industry!

“Kathy Swartz, Justine Sanchez, Marlene Brown, Rebekah Hren and others involved with SEI have supported WISE in various ways over the past few years of our development.  Through direct feedback, advice and encouragement to shape our mission and programs and keep us true to the heartbeat of the industry. I greatly appreciate their sharing in the vision of WISE as an independent non-profit that leverages technical depth and celebrates diversity and inclusion in the solar energy industry.  We are thrilled be in a position to solidify this formal and positive relationship with SEI and will continue to provide much needed career resources for our community.  We look forward to working with SEI through this MOU to ensure that our community has access to job training resources and career support and that our efforts are complementary and successful for the long haul.” Kristen Nicole –  WISE Executive Director

SEI was founded in 1991 as a nonprofit educational organization, and since has trained over 50,000 students around the world. Their mission is to provide industry-leading technical training and expertise in renewable energy to empower people, communities, and businesses worldwide. SEI envisions a world powered by renewable energy.

Headquartered in Boston, MA, WISE is the only 501c3 non-profit network dedicated to advocating diversity and inclusion in the solar energy industry.

The post SEI and WISE Team Up to Empower Women Through Solar Training Partnership appeared first on Solar Training - Solar Installer Training - Solar PV Installation Training - Solar Energy Courses - Renewable Energy Education - NABCEP - Solar Energy International (SEI).

Google Search Console Reliability: Webmaster Tools on Trial

Posted by rjonesx.

There are a handful of data sources relied upon by nearly every search engine optimizer. Google Search Console (formerly Google Webmaster Tools) has perhaps become the most ubiquitous. There are simply some things you can do with GSC, like disavowing links, that cannot be accomplished anywhere else, so we are in some ways forced to rely upon it. But, like all sources of knowledge, we must put it to the test to determine its trustworthiness — can we stake our craft on its recommendations? Let's see if we can pull back the curtain on GSC data and determine, once and for all, how skeptical we should be of the data it provides.

Testing data sources

Before we dive in, I think it is worth having a quick discussion about how we might address this problem. There are basically two concepts that I want to introduce for the sake of this analysis: internal validity and external validity.

Internal validity refers to whether the data accurately represents what Google knows about your site.

External validity refers to whether the data accurately represents the web.

These two concepts are extremely important for our discussion. Depending upon the problem we are addressing as SEOs, we may care more about one or another. For example, let's assume that page speed was an incredibly important ranking factor and we wanted to help a customer. We would likely be concerned with the internal validity of GSC's "time spent downloading a page" metric because, regardless of what happens to a real user, if Google thinks the page is slow, we will lose rankings. We would rely on this metric insofar as we were confident it represented what Google believes about the customer's site. On the other hand, if we are trying to prevent Google from finding bad links, we would be concerned about the external validity of the "links to your site" section because, while Google might already know about some bad links, we want to make sure there aren't any others that Google could stumble upon. Thus, depending on how well GSC's sample links comprehensively describe the links across the web, we might reject that metric and use a combination of other sources (like Open Site Explorer, Majestic, and Ahrefs) which will give us greater coverage.

The point of this exercise is simply to say that we can judge GSC's data from multiple perspectives, and it is important to tease these out so we know when it is reasonable to rely upon GSC.

GSC Section 1: HTML Improvements

Of the many useful features in GSC, Google provides a list of some common HTML errors it discovered in the course of crawling your site. This section, located at Search Appearance > HTML Improvements, lists off several potential errors including Duplicate Titles, Duplicate Descriptions, and other actionable recommendations. Fortunately, this first example gives us an opportunity to outline methods for testing both the internal and external validity of the data. As you can see in the screenshot below, GSC has found duplicate meta descriptions because a website has case insensitive URLs and no canonical tag or redirect to fix it. Essentially, you can reach the page from either /Page.aspx or /page.aspx, and this is apparent as Googlebot had found the URL both with and without capitalization. Let's test Google's recommendation to see if it is externally and internally valid.

External Validity: In this case, the external validity is simply whether the data accurately reflects pages as they appear on the Internet. As one can imagine, the list of HTML improvements can be woefully out of date dependent upon the crawl rate of your site. In this case, the site had previously repaired the issue with a 301 redirect.

This really isn't terribly surprising. Google shouldn't be expected to update this section of GSC every time you apply a correction to your website. However, it does illustrate a common problem with GSC. Many of the issues GSC alerts you to may have already been fixed by you or your web developer. I don't think this is a fault with GSC by any stretch of the imagination, just a limitation that can only be addressed by more frequent, deliberate crawls like Moz Pro's Crawl Audit or a standalone tool like Screaming Frog.

Internal Validity: This is where things start to get interesting. While it is unsurprising that Google doesn't crawl your site so frequently as to capture updates to your site in real-time, it is reasonable to expect that what Google has crawled would be reflected accurately in GSC. This doesn't appear to be the case.

By executing an info:http://concerning-url query in Google with upper-case letters, we can determine some information about what Google knows about the URL. Google returns results for the lower-case version of the URL! This indicates that Google both knows about the 301 redirect correcting the problem and has corrected it in their search index. As you can imagine, this presents us with quite a problem. HTML Improvement recommendations in GSC not only may not reflect changes you made to your site, it might not even reflect corrections Google is already aware of. Given this difference, it almost always makes sense to crawl your site for these types of issues in addition to using GSC.

GSC Section 2: Index Status

The next metric we are going to tackle is Google's Index Status, which is supposed to provide you with an accurate number of pages Google has indexed from your site. This section is located at Google Index > Index Status. This particular metric can only be tested for internal validity since it is specifically providing us with information about Google itself. There are a couple of ways we could address this...

  1. We could compare the number provided in GSC to site: commands
  2. We could compare the number provided in GSC to the number of internal links to the homepage in the internal links section (assuming 1 link to homepage from every page on the site)

We opted for both. The biggest problem with this particular metric is being certain what it is measuring. Because GSC allows you to authorize the http, https, www, and non-www version of your site independently, it can be confusing as to what is included in the Index Status metric.

We found that when carefully applied to ensure no crossover of varying types (https vs http, www vs non-www), the Index Status metric seemed to be quite well correlated with the site:site.com query in Google, especially on smaller sites. The larger the site, the more fluctuation we saw in these numbers, but this could be accounted for by approximations performed by the site: command.

We found the link count method to be difficult to use, though. Consider the graphic above. The site in question has 1,587 pages indexed according to GSC, but the home page to that site has 7,080 internal links. This seems highly unrealistic, as we were unable to find a single page, much less the majority of pages, with 4 or more links back to the home page. However, given the consistency with the site: command and GSC's Index Status, I believe this is more of a problem with the way internal links are represented than with the Index Status metric.

I think it is safe to conclude that the Index Status metric is probably the most reliable one available to us in regards to the number of pages actually included in Google's index.

GSC Section 3: Internal Links

The Internal Links section found under Search Traffic > Internal Links seems to be rarely used, but can be quite insightful. If External Links tells Google what others think is important on your site, then Internal Links tell Google what you think is important on your site. This section once again serves as a useful example of knowing the difference between what Google believes about your site and what is actually true of your site.

Testing this metric was fairly straightforward. We took the internal links numbers provided by GSC and compared them to full site crawls. We could then determine whether Google's crawl was fairly representative of the actual site.

Generally speaking, the two were modestly correlated with some fairly significant deviation. As an SEO, I find this incredibly important. Google does not start at your home page and crawl your site in the same way that your standard site crawlers do (like the one included in Moz Pro). Googlebot approaches your site via a combination of external links, internal links, sitemaps, redirects, etc. that can give a very different picture. In fact, we found several examples where a full site crawl unearthed hundreds of internal links that Googlebot had missed. Navigational pages, like category pages in the blog, were crawled less frequently, so certain pages didn't accumulate nearly as many links in GSC as one would have expected having looked only at a traditional crawl.

As search marketers, in this case we must be concerned with internal validity, or what Google believes about our site. I highly recommend comparing Google's numbers to your own site crawl to determine if there is important content which Google determines you have ignored in your internal linking.

GSC Section 4: Links to Your Site

Link data is always one of the most sought-after metrics in our industry, and rightly so. External links continue to be the strongest predictive factor for rankings and Google has admitted as much time and time again. So how does GSC's link data measure up?

In this analysis, we compared the links presented to us by GSC to those presented by Ahrefs, Majestic, and Moz for whether those links are still live. To be fair to GSC, which provides only a sampling of links, we only used sites that had fewer than 1,000 total backlinks, increasing the likelihood that we get a full picture (or at least close to it) from GSC. The results are startling. GSC's lists, both "sample links" and "latest links," were the lowest-performing in terms of "live links" for every site we tested, never once beating out Moz, Majestic, or Ahrefs.

I do want to be clear and upfront about Moz's performance in this particular test. Because Moz has a smaller total index, it is likely we only surface higher-quality, long-lasting links. Our out-performing Majestic and Ahrefs by just a couple of percentage points is likely a side effect of index size and not reflective of a substantial difference. However, the several percentage points which separate GSC from all 3 link indexes cannot be ignored. In terms of external validity — that is to say, how well this data reflects what is actually happening on the web — GSC is out-performed by third-party indexes.

But what about internal validity? Does GSC give us a fresh look at Google's actual backlink index? It does appear that the two are consistent insofar as rarely reporting links that Google is already aware are no longer in the index. We randomly selected hundreds of URLs which were "no longer found" according to our test to determine if Googlebot still had old versions cached and, uniformly, that was the case. While we can't be certain that it shows a complete set of Google's link index relative to your site, we can be confident that Google tends to show only results that are in accord with their latest data.

GSC Section 5: Search Analytics

Search Analytics is probably the most important and heavily utilized feature within Google Search Console, as it gives us some insight into the data lost with Google's "Not Provided" updates to Google Analytics. Many have rightfully questioned the accuracy of the data, so we decided to take a closer look.

Experimental analysis

The Search Analytics section gave us a unique opportunity to utilize an experimental design to determine the reliability of the data. Unlike some of the other metrics we tested, we could control reality by delivering clicks under certain circumstances to individual pages on a site. We developed a study that worked something like this:

  1. Create a series of nonsensical text pages.
  2. Link to them from internal sources to encourage indexation.
  3. Use volunteers to perform searches for the nonsensical terms, which inevitably reveal the exact-match nonsensical content we created.
  4. Vary the circumstances under which those volunteers search to determine if GSC tracks clicks and impressions only in certain environments.
  5. Use volunteers to click on those results.
  6. Record their actions.
  7. Compare to the data provided by GSC.

We decided to check 5 different environments for their reliability:

  1. User performs search logged into Google in Chrome
  2. User performs search logged out, incognito in Chrome
  3. User performs search from mobile
  4. User performs search logged out in Firefox
  5. User performs the same search 5 times over the course of a day

We hoped these variants would answer specific questions about the methods Google used to collect data for GSC. We were sorely and uniformly disappointed.

Experimental results

Method Delivered GSC Impressions GSC Clicks
Logged In Chrome 11 0 0
Incognito 11 0 0
Mobile 11 0 0
Logged Out Firefox 11 0 0
5 Searches Each 40 2 0

GSC recorded only 2 impressions out of 84, and absolutely 0 clicks. Given these results, I was immediately concerned about the experimental design. Perhaps Google wasn't recording data for these pages? Perhaps we didn't hit a minimum number necessary for recording data, only barely eclipsing that in the last study of 5 searches per person?

Unfortunately, neither of those explanations made much sense. In fact, several of the test pages picked up impressions by the hundreds for bizarre, low-ranking keywords that just happened to occur at random in the nonsensical tests. Moreover, many pages on the site recorded very low impressions and clicks, and when compared with Google Analytics data, did indeed have very few clicks. It is quite evident that GSC cannot be relied upon, regardless of user circumstance, for lightly searched terms. It is, by this account, not externally valid — that is to say, impressions and clicks in GSC do not reliably reflect impressions and clicks performed on Google.

As you can imagine, I was not satisfied with this result. Perhaps the experimental design had some unforeseen limitations which a standard comparative analysis would uncover.

Comparative analysis

The next step I undertook was comparing GSC data to other sources to see if we could find some relationship between the data presented and secondary measurements which might shed light on why the initial GSC experiment had reflected so poorly on the quality of data. The most straightforward comparison was that of GSC to Google Analytics. In theory, GSC's reporting of clicks should mirror Google Analytics's recording of organic clicks from Google, if not identically, at least proportionally. Because of concerns related to the scale of the experimental project, I decided to first try a set of larger sites.

Unfortunately, the results were wildly different. The first example site received around 6,000 clicks per day from Google Organic Search according to GA. Dozens of pages with hundreds of organic clicks per month, according to GA, received 0 clicks according to GSC. But, in this case, I was able to uncover a culprit, and it has to do with the way clicks are tracked.

GSC tracks a click based on the URL in the search results (let's say you click on /pageA.html). However, let's assume that /pageA.html redirects to /pagea.html because you were smart and decided to fix the casing issue discussed at the top of the page. If Googlebot hasn't picked up that fix, then Google Search will still have the old URL, but the click will be recorded in Google Analytics on the corrected URL, since that is the page where GA's code fires. It just so happened that enough cleanup had taken place recently on the first site I tested that GA and GSC had a correlation coefficient of just .52!

So, I went in search of other properties that might provide a clearer picture. After analyzing several properties without similar problems as the first, we identified a range of approximately .94 to .99 correlation between GSC and Google Analytics reporting on organic landing pages. This seems pretty strong.

Finally, we did one more type of comparative analytics to determine the trustworthiness of GSC's ranking data. In general, the number of clicks received by a site should be a function of the number of impressions it received and at what position in the SERP. While this is obviously an incomplete view of all the factors, it seems fair to say that we could compare the quality of two ranking sets if we know the number of impressions and the number of clicks. In theory, the rank tracking method which better predicts the clicks given the impressions is the better of the two.

Call me unsurprised, but this wasn't even close. Standard rank tracking methods performed far better at predicting the actual number of clicks than the rank as presented in Google Search Console. We know that GSC's rank data is an average position which almost certainly presents a false picture. There are many scenarios where this is true, but let me just explain one. Imagine you add new content and your keyword starts at position 80, then moves to 70, then 60, and eventually to #1. Now, imagine you create a different piece of content and it sits at position 40, never wavering. GSC will report both as having an average position of 40. The first, though, will receive considerable traffic for the time that it is in position 1, and the latter will never receive any. GSC's averaging method based on impression data obscures the underlying features too much to provide relevant projections. Until something changes explicitly in Google's method for collecting rank data for GSC, it will not be sufficient for getting at the truth of your site's current position.

Reconciliation

So, how do we reconcile the experimental results with the comparative results, both the positives and negatives of GSC Search Analytics? Well, I think there are a couple of clear takeaways.

  1. Impression data is misleading at best, and simply false at worst: We can be certain that all impressions are not captured and are not accurately reflected in the GSC data.
  2. Click data is proportionally accurate: Clicks can be trusted as a proportional metric (ie: correlates with reality) but not as a specific data point.
  3. Click data is useful for telling you what URLs rank, but not what pages they actually land on.

Understanding this reconciliation can be quite valuable. For example, if you find your click data in GSC is not proportional to your Google Analytics data, there is a high probability that your site is utilizing redirects in a way that Googlebot has not yet discovered or applied. This could be indicative of an underlying problem which needs to be addressed.

Final thoughts

Google Search Console provides a great deal of invaluable data which smart webmasters rely upon to make data-driven marketing decisions. However, we should remain skeptical of this data, like any data source, and continue to test it for both internal and external validity. We should also pay careful attention to the appropriate manners in which we use the data, so as not to draw conclusions that are unsafe or unreliable where the data is weak. Perhaps most importantly: verify, verify, verify. If you have the means, use different tools and services to verify the data you find in Google Search Console, ensuring you and your team are working with reliable data. Also, there are lots of folks to thank here -Michael Cottam, Everett Sizemore, Marshall Simmonds, David Sottimano, Britney Muller, Rand Fishkin, Dr. Pete and so many more. If I forgot you, let me know!


Sign up for The Moz Top 10, a semimonthly mailer updating you on the top ten hottest pieces of SEO news, tips, and rad links uncovered by the Moz team. Think of it as your exclusive digest of stuff you don't have time to hunt down but want to read!

Monday, January 30, 2017

BP’s Energy Outlook Forecasts that Fossil Fuels Will Remain Dominant

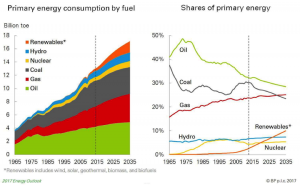
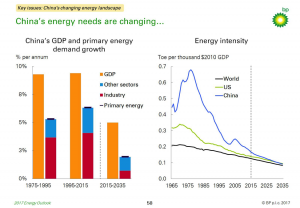
BP’s Energy Outlook provides global energy supply and demand forecasts through 2035. In its 2017 edition, global energy demand is expected to increase by 30 percent to 2035 (an average annual growth rate of 1.3 percent) due to increasing prosperity in developing countries. Like other outlooks, BP projects that oil, natural gas, and coal remain the major sources of energy through 2035, supplying over 75 percent of total energy in that year, but lower than the 86 percent they supplied in 2015. Natural gas is the fastest growing fossil fuel and overtakes coal as the second largest global fuel source before 2035. Non-hydroelectric renewable energy increases and supplies 20 percent of global electricity generation by 2035. Carbon dioxide emissions continue to grow, but at less than a third of the rate in the past 20 years increasing by 13 percent by 2035.[i]

Source: http://www.ogj.com/articles/2017/01/bp-energy-outlook-global-energy-demand-to-grow-30-to-2035.html

Oil

Oil demand is expected to grow at an average annual rate of 0.7 percent.[ii] The transportation sector is expected to consume most of the world’s oil with its share of global demand remaining near 60 percent in 2035. The transportation sector accounts for about two thirds of the growth in oil demand over the forecast period. Oil demand for cars increases by around 4 million barrels per day due to a doubling of the global car fleet by 2035. The number of electric cars is assumed to increase from 1.2 million in 2015 to about 100 million in 2035, or about 5 percent of the global car fleet.

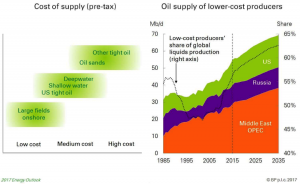
While the rate of oil demand growth is expected to slow toward the end of the forecast period, global oil resources are expected to be abundant. The abundance of oil supply results in low-cost producers, such as the Middle East OPEC, Russia, and the United States, to use their competitive advantage to increase their market share at the expense of higher-cost producers. OPEC is expected to account for almost 70 percent of global supply growth, increasing production by 9 million barrels per day, while non-OPEC supply grows by just over 4 million barrels per day–led by the United States.

Source: http://www.ogj.com/articles/2017/01/bp-energy-outlook-global-energy-demand-to-grow-30-to-2035.html

Natural Gas

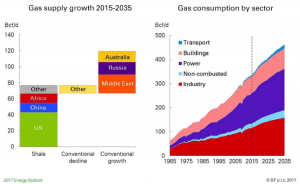
Natural gas demand is expected to grow at an average rate of 1.6 percent per year between 2015 and 2035—faster than the growth in either oil or coal, overtaking coal as the second-largest fuel source before 2035. Shale gas production grows at 5.4 percent per year and accounts for about two-thirds of the increase in natural gas supplies, led by the United States where shale production more than doubles.

The growth in liquefied natural gas (LNG), driven by increasing supplies in Australia and the United States, is expected to lead to a globally integrated natural gas market anchored by U.S. gas prices. The BP outlook expects LNG to supply over half of traded gas by 2035. About a third of LNG’s growth occurs over the next 4 years as projects currently under development come on-line.

Source: http://www.ogj.com/articles/2017/01/bp-energy-outlook-global-energy-demand-to-grow-30-to-2035.html

Coal

Growth in global coal demand is expected to increase at only 0.2 percent per year compared to 2.7 percent per year over the past 20 years. While China remains the largest market for coal, India is the largest growth market for coal, with its share of world coal demand doubling from around 10 percent in 2015 to 20 percent in 2035.

Source: BP Power Point, http://www.bp.com/en/global/corporate/energy-economics/energy-outlook.html

Non-hydroelectric Renewable Energy

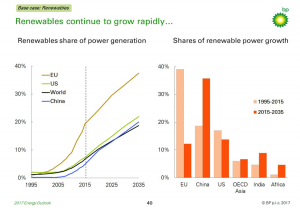
Non-hydroelectric renewables in the power generation sector are projected to be the fastest growing fuel source, growing at an average rate of 7.6 percent per year, quadrupling over the outlook, due to increasing competitiveness of solar and wind power and the move to de-carbonization. Non-hydroelectric renewable energy accounts for 40 percent of the growth in power generation, with their share of global power increasing from 7 percent in 2015 to almost 20 percent by 2035.

The European Union is expected to continue its penetration of renewable energy in the power sector, with the share of renewable energy doubling over the forecast period, reaching almost 40 percent by 2035. However, China is the largest overall source of growth in renewable energy over the next 20 years.

Source: BP Power Point, http://www.bp.com/en/global/corporate/energy-economics/energy-outlook.html

China

China is expected to account for half of the oil demand growth in the forecast that comes entirely from developing countries. China’s natural gas consumption grows faster than its domestic production, so by 2035, imported gas comprises nearly 40 percent of total consumption, up from 30 percent in 2015. However, towards the end of the forecast period, China becomes the second largest shale gas supplier.

China’s coal consumption is projected to peak in the mid-2020s, due to China’s move towards lower-carbon fuels. However, China still remains the world’s largest market for coal, accounting for nearly half of global coal consumption in 2035.

China is expected to account for almost three-quarters of the increase in nuclear generation, roughly equivalent to introducing a new nuclear reactor every three months for the next 20 years. China’s increased nuclear generation helps maintain nuclear’s share and modest growth rate of 2.3 percent per year as other countries close some of their nuclear units.

China is the largest source of growth in non-hydroelectric renewable energy over the next 20 years, adding more renewable power than the European Union and the United States combined.

Source: BP Power Point, http://www.bp.com/en/global/corporate/energy-economics/energy-outlook.html

Carbon Dioxide Emissions

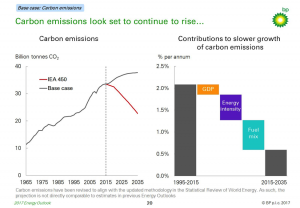
Carbon dioxide emissions are projected to grow at less than a third of the rate of the past 20 years – at 0.6 percent per year compared to 2.1 percent per year. Carbon dioxide emissions are expected to increase by 13 percent by 2035, and thereby are not forecast to comply with the Paris Agreement, where they would need to decrease to achieve the agreement’s goals. The chart below shows base case emissions compared to another scenario (International Energy Agency’s 450 Scenario) where emissions decline by 30 percent to meet the goals of the Paris Agreement.

The slowdown in carbon dioxide emissions growth reflects the accelerating decline in energy intensity (energy consumption per unit of GDP) and the change in the fuel mix, with coal consumption slowing and natural gas, nuclear power, hydroelectric power and renewable energy together supplying almost 80 percent of the increase in energy demand.

Source: BP Power Point, http://www.bp.com/en/global/corporate/energy-economics/energy-outlook.html

Conclusion

BP is forecasting that fossil fuels will remain the dominant source of world energy despite the growth in less carbon and zero carbon intensive fuels. However, natural gas, nuclear power, hydroelectric power and renewable energy together supply almost 80 percent of the increase in forecasted energy demand through 2035. BP also expects the goals of the Paris Agreement not to be met with carbon dioxide emissions increasing, rather than decreasing, in the forecast.


[i] BP, Energy Overview-base case, http://www.bp.com/en/global/corporate/energy-economics/energy-outlook/energy-overview-the-base-case.html and BP Energy Outlook, http://www.bp.com/en/global/corporate/energy-economics/energy-outlook.html

[ii] Oil & Gas Journal, BP Energy Outlook: Global energy demand to grow 30% to 2035, January 25, 2015,http://www.ogj.com/articles/2017/01/bp-energy-outlook-global-energy-demand-to-grow-30-to-2035.html

The post BP’s Energy Outlook Forecasts that Fossil Fuels Will Remain Dominant appeared first on IER.

Why You Should Steal My Daughter's Playbook for Effective Email Outreach

Posted by ronell-smith

During the holidays, my youngest daughter apparently had cabin fever after being in the house for a couple of days. While exiting the bedroom, my wife found the note below on the floor, after the former had slyly slid it under the door.

Though tired and not really feeling like leaving the house, we had to reward the youngster for her industriousness. And her charm.

Her effective "outreach" earned plaudits from my wife.

"At least she did it the right way," she remarked. "She cleaned her room, washed dishes, and read books all day, obviously part of an attempt to make it hard for us to say no. After all she did, though, she earned it."

Hmm...

She earned it.

Can you say as much about your outreach?

We're missing out on a great opportunity

Over the last few months, I've been thinking a lot about outreach, specifically email outreach.

It initially got my attention because I see it so badly handled, even by savvy marketers.

But I didn't fully appreciate the significance of the problem until I started thinking about the resulting impact of bad outreach, particularly since it remains one of the best, most viable means of garnering attention, traffic, and links to our websites.

What I see most commonly is a disregard of the needs of the person on the other end of the email.

Too often, it's all about the "heavy ask" as opposed to the warm touch.

  • Heavy ask: "Hi Ronell ... We haven't met. ... Could you share my article?"
  • Warm touch: "Hi Ronell ... I enjoyed your Moz post. ... We're employing similar tactics at my brand."

That's it.

You're likely saying to yourself, "But Ronell, the second person didn't get anything in return."

I beg to differ. The first person likely lost me, or whomever else they reach out to to using similar tactics; the second person will remain on my radar.

Outreach is too important to be left to chance or poor etiquette. A few tweaks here and there can help our teams perform optimally.

#1: Build rapport: Be there in a personal way before you need them

The first no-no of effective outreach comes right out of PR 101: Don't let the first time I learn of you or your brand be when you need me. If the brand you hope to attain a link from is worthwhile, you should be on their radar well in advance of the ask.

Do your research to find out who the relevant parties are at the brand, then make it your business to learn about them, via social media and any shared contacts you might have.

Then reach out to them... to say hello. Nothing more.

This isn't the time to ask for anything. You're simply making yourself known, relevant, and potentially valuable down the road.

Notice how, in the example below, the person emailing me NEVER asks for anything?

The author did three things that played big. She...

  • Mentioned my work, which means she'd done her homework
  • Highlighted work she'd done to create a post
  • Didn't assume I would be interested in her content (we'll discuss in greater detail below)

Hiring managers like to say, "A person should never be surprised at getting fired," meaning they should have some prior warning.

Similarly, for outreach to be most effective, the person you're asking for a link from should know of you/your brand in advance.

Bonuses: Always, always, always use "thank you" instead of "thanks." The former is far more thoughtful and sincere, while the latter can seem too casual and unfeeling.

#2: Be brief, be bold, be gone

One of my favorite lines from the Greek tragedy Antigone, by Sophocles, is "Tell me briefly — not in some lengthy speech."

If your pitch is more than three paragraphs, go back to the drawing board.

You're trying to pique their interest, to give them enough to comfortably go on, not bore them with every detail.

The best outreach messages steal a page from the PR playbook:

  • They respect the person's time
  • They show a knowledge of the person's brand, content, and interests with regard to coverage
  • They make the person's job easier (i.e., something the person would deem useful but not necessarily easily accessible)

We must do the same.

  • Be brief in highlighting the usefulness of what you offer and how it helps them in some meaningful way
  • Be bold in declaring your willingness to help their brand as much as your own
  • Be gone by exiting without spilling every single needless detail

Bonus: Be personal by using the person's name at least once in the text since it fosters a greatest level of personalization and thoughtfulness (most people enjoy hearing their names):

"I read your blog frequently, Jennifer."

#3: Understand that it's not about you

During my time as a newspaper business reporter and book reviewer, nothing irked me more than having people assume that because they valued what their brand offered, I must feel the same way.

They were wrong 99 percent of the time.

Outreach in our industry is rife with this if-it's-good-for-me-it's-good-for-you logic.

Instead of approaching a potential link opportunity from the perspective of "How do I influence this party to grant me a link," a better approach is to consider "What's obviously in it for them?"

(I emphasize "obviously" because we often pretend the benefit is obvious when it's typically anything but.)

Step back and consider all the things that'll be in play as they consider a link from you:

  • Relationship - Do they they know you/know of you?
  • Brand - Is your brand reputable?
  • Content - Does your company create and share quality content?
  • This content - Is the content you're hoping for a link for high-quality and relevant?

In the best case scenario, you should pass this test with flying colors. But at the very least you should be able tp successfully counter any of these potential objections.

#4: Don't assume anything

Things never go well when an outreach email begins "I knew you'd be interested in this."

Odds suggest you aren't prescient, which can only mean you're wrong.

What's more, if you did know I was interested in it, I should not be learning about the content after it was created. You should involved me from the beginning.

Therefore, instead of assuming I'll find your content valuable, ensure that you're correct by enlisting their help during the content creation process:

  • Topic - Find out what they're working on or see as the biggest issues that deserve attention
  • Contribution - Ask if they'd like to be part of the content you create
  • Ask about others - Enlist their help to find other potential influencers for your content. Doing so gives your content and your outreach legs (we discuss in greater detail below)

#5: Build a network

Michael Michalowicz, via his 2012 book The Pumpkin Plan, shared an outreach tactic I've been using for years in my own work. Instead of asking customers to recommend other customers for a computer service company he formerly owned, he asked his customers to recommend other non-competing vendors.


Genius!

Whereas a customer is likely to recommend another customer or two, a vendor is likely able to recommend many dozens of customers who could use his service.

This is instructive for outreach.

Rather than asking the person you're outreaching to for recommendations of other marketers who could be involved in the project, a better idea might be to ask them "What are some of the other publications or blogs you've worked with?"

You could then conduct a site search, peruse the content the former has been a part of, then use this information as a future guide for the types and quality of content you should be producing to get on the radar for influencers and brands.

After all, for outreach to be sustainable and most effective, it must be scalable in an easy-to-replicate (by the internal team, at least) fashion.

Bonus: Optimally, your outreach should not be scalable — for anyone but you/your team. That is, it's best to have a unique-to-your-brand process that's tough to achieve or acquire, which means it's far less likely others will know about, copy or use it or one like it.

Awaken your inner child, er, PR person

Elements of the five tips shared above have been, singularly, on my mind for the better part of two years. However, they only coalesced after I read the note my daughter shared, primarily because her message delivered on each point so effectively.

She didn't wait until she needed something to get on our radar; never over-sold the message; was selfless in realizing we all likely needed to get out the house; didn't assume we were on the same page; and activated her network by first sharing the note with her sister first, and, through her mom, me.

Now, the question we must all ask ourselves is if the methods we employ as effective?


Sign up for The Moz Top 10, a semimonthly mailer updating you on the top ten hottest pieces of SEO news, tips, and rad links uncovered by the Moz team. Think of it as your exclusive digest of stuff you don't have time to hunt down but want to read!

Thursday, January 26, 2017

President Trump Advances Keystone XL and Dakota Access Pipelines

President Trump recently signed executive actions to advance the construction of the Keystone XL and Dakota Access pipelines. Both oil pipelines were delayed or denied under former President Obama.[i]

The Keystone XL pipeline was delayed for around 7 years and then denied by the Obama Administration in late 2015 because he felt it would undercut U.S. efforts to obtain a global climate change deal that became part of his “Paris Agreement” legacy. TransCanada, the pipeline company behind the Keystone XL pipeline, sued the Obama Administration for $15 billion in damages due to the costs it incurred awaiting a final decision.[ii]

After the Dakota Access pipeline was approved, permitted, and under construction, the Obama Administration halted its construction because the Standing Rock Sioux Tribe and its supporters claimed the pipeline threatened the drinking water and their cultural sites. Despite two federal courts ruling in favor of the Dakota Access pipeline, the U.S. Army Corps of Engineers decided it needed to explore alternate routes for the pipeline at the end of last year when the pipeline was already over 90 percent complete.[iii] The Trump executive order “directs agencies to expedite reviews and approvals for the remaining portions of this pipeline.”[iv]

TransCanada is to submit a new permit application, and the State Department is to make a decision on the pipeline in 60 days. President Trump vowed to “renegotiate some of the terms” of the Keystone XL pipeline. Trump also issued executive actions streamlining the regulatory process for pipeline construction and shortening the environmental review process.[v]

Keystone XL Pipeline

The Keystone XL pipeline is designed to move 830,000 barrels a day of oil sands from Canada to the U.S. Gulf Coast where many refineries are located that are configured to process heavy oil. Because the Keystone XL pipeline would cross the Canadian border, it requires a Presidential permit. Studies reviewed by Obama’s State Department showed that the pipeline would not have a significant impact on the environment. Never the less, Obama delayed a decision regarding the pipeline for 7 years and then rejected it shortly before an international conference converged in Paris to hammer out a climate agreement that Obama viewed as part of his environmental legacy.

The Obama State Department also noted that the pipeline would not impact the surrounding water, vegetation, wildlife or air quality. Further, the pipeline would help the environment, because moving oil by pipeline produces 42 percent fewer emissions than transporting oil by rail, which is how the oil is being transported in lieu of the new pipeline.[vi] Since 2008, the use of rail to ship oil had increased by a factor of 50, adding $5 to $10 per barrel in additional cost and greater environmental and safety risks.[vii] TransCanada plans to build Keystone XL according to rigorous safety standards, including 59 new safety rules federal regulators added to TransCanada’s proposal.[viii]

According to the State Department, the construction of Keystone will create 3,000 to 4,000 local jobs, which translates into about $100 million in earnings for American workers. TransCanada will also pay millions of dollars in local property taxes.

Dakota Access Pipeline

The Dakota Access Pipeline is a $3.8 billion, 1,100-mile oil pipeline under construction in the Upper Midwest that will move 470,000 to 570,000 barrels of oil per day from the Bakken basin in North Dakota to Illinois.[ix] It was planned to be completed by year-end 2016 until the Obama Administration stopped its construction near Lake Oahe when the pipeline was over 50 percent complete. Obama’s halt to the pipeline came despite a judge ruling in favor of the pipeline and against the Standing Rock Sioux tribe and other opponents, who wanted construction halted because they claim there may be possible contamination of drinking water and disruption to culturally important sites. Despite having already granted approval last July, the U.S. Army Corps of Engineers said it would not allow construction near Lake Oahe until it determined whether it needed to reconsider its previous approvals under the National Environmental Policy Act.

U.S. District Judge James Boasberg did not grant an injunction sought by the tribe because the Army Corps of Engineers had done due diligence and documented dozens of attempts to consult with the tribe from the fall of 2014 through the spring of 2016, including at least three site visits to Lake Oahe to assess any potential effects on historical properties.

Despite an environmental impact statement having already been undertaken and showing no significant impact on the environment, in December, Assistant Army Secretary for Civil Works Jo-Ellen Darcy indicated that a broader environmental impact statement was warranted, which can take up to two years to complete. Earlier this month, the Army Corps of Engineers said that they were going to launch a full environmental study of the crossing at the Missouri River reservoir in North Dakota and that they wanted to examine alternate routes.[x]

The pipeline company, Energy Transfer Partners, asked U.S. District Judge James Boasberg to stop the Corps from publishing a notice in the Federal Register announcing the study and to rule on whether the company has the necessary permits to proceed with laying pipes under Lake Oahe.

The pipeline will provide millions in state and local revenues during the construction phase and an estimated $129 million annually in property and income taxes–an estimated $50 million annually in property taxes and nearly $74 million in sales taxes to the states of North Dakota, South Dakota, Iowa and Illinois to support services such as schools, roads, and emergency services. But, the Obama Administration delays are costing the company an estimated $1.4 billion just in the first year alone.[xi]

Former President Obama in his halting of the construction of the pipeline was carrying out the demands of 31 environmental groups, who requested that the president intervene and repeal the permits for the pipeline. Many of these groups are part of the “keep it in the ground” movement, which seeks to deny Americans the use of any oil, natural gas or coal and opposes all aspects of fossil energy exploration, development, production or transportation. Fossil energy supplies over 80 percent of our energy today and is expected to supply almost as much by 2040, according to many forecasters.

Conclusion

These pipelines will improve U.S. energy security and create new jobs, which President Trump realizes by issuing the executive actions. Pipeline infrastructure also represents the most cost-effective and safest method of transport, and reduces congestion on roads and railways, freeing up their use to move other commodities. President Trump by issuing these orders is demonstrating that the federal government can work for the people, rather than obstructing growth, entrepreneurship, and ingenuity.


[i] New York Times, Trump Revives Keystone Pipeline Rejected by Obama, January 24, 2017, https://www.nytimes.com/2017/01/24/us/politics/keystone-dakota-pipeline-trump.html and Boston Globe, Trump advances Keystone XL, Dakota Access pipelines, January 24, 2017, http://www.bostonglobe.com/news/nation/2017/01/24/trump-advance-keystone-dakota-access-pipelines/ozRWsCjgkWiiR55H5OgQ0H/story.html

[ii] Financial Post, With Donald Trump’s blessing, Keystone XL is getting ready for its revival, December 12, 2016, http://business.financialpost.com/news/energy/with-donald-trumps-blessing-keystone-xl-is-getting-ready-for-its-revival?__lsa=e765-c467

[iii] Daily Caller, Dakota Tribe Says Trump’s Pipeline Approval Violates Groups’ Treaty Rights, January 25, 2017, http://dailycaller.com/2017/01/25/dakota-tribe-says-trumps-pipeline-approval-violates-groups-treaty-rights/

[iv] CNBC, Trump signs executive orders to advance Keystone XL, Dakota Access pipelines, January 24, 2017, http://www.cnbc.com/2017/01/24/trump-to-advance-keystone-dakota-pipelines-with-executive-order-on-tuesday-nbc.html

[v] CNN, Trump advances controversial oil pipelines with executive action, January 24, 2017, http://www.cnn.com/2017/01/24/politics/trump-keystone-xl-dakota-access-pipelines-executive-actions/

[vi] Washington Times, Criticism of Keystone proving baseless, embarrassing, June 9, 2015, http://www.washingtontimes.com/news/2015/jun/9/drew-johnson-criticism-of-keystone-pipeline-provin/

[vii] Institute for Energy Research, http://instituteforenergyresearch.org/analysis/keystone-xl-it-is-time-for-president-obama-to-approve-it/

[viii] U.S. News, EPA: Keystone XL Will Impact Global Warming, February 3, 2015, http://www.usnews.com/news/articles/2015/02/03/epa-keystone-xl-pipeline-will-impact-global-warming

[ix] Wall Street Journal, U.S. Agencies Order Dakota Access Pipeline Work Halted After Judge Rules It Can Proceed, September 9, 2016, http://www.wsj.com/articles/judge-rules-3-8-billion-dakota-access-pipeline-can-proceed-1473450128

[x] The Bismarck Tribune, Dakota Access company seeks to block pipeline study, January 17, 2017, http://bismarcktribune.com/news/state-and-regional/dakota-access-company-seeks-to-block-pipeline-study/article_c9a13fd3-db63-59fa-9ffa-41c98b8b4bf2.html

[xi] Energy Transfer, The Route, https://daplpipelinefacts.com/

The post President Trump Advances Keystone XL and Dakota Access Pipelines appeared first on IER.

Wednesday, January 25, 2017

Ontario Achieves Minimal Emission Reductions From Closing Coal Plants

The Province of Ontario, Canada decided to shutter its coal plants in order to reduce criteria pollutants.[i] According to the Fraser Institute, the environmental benefit of shuttering the coal-fired power plants was minimal and could have been achieved more economically by adding scrubbers to the coal plants rather than closing them.[ii] The political agenda in the province made it impossible to consider other options, resulting in the closure of the last coal-fired power plant in 2014 and making new coal plants illegal despite the knowledge that those plants contributed minimally to emissions of criteria pollutants in the province. Ontario’s achievement from its hasty decision was an increase in electricity prices for its consumers. Despite this outcome, the national Canadian government and other provinces are considering a similar move regarding the country’s coal plants.

While the policy direction that Ontario undertook is different than former President Obama’s “Clean Power Plan”, the result will be similar in that there will be premature closures of coal-fired power plants, higher electricity prices for consumers, and little environmental gain.

Fraser Institute Report

The Fraser Institute found that air pollution levels decreased slightly as a result of shutting down the coal plants in Toronto, Hamilton and Ottawa, but not enough to warrant the expense. The most significant closures were the Lambton and Nanticoke coal plants, which represented 25 percent of Ontario’s supply of electricity.[iii] The coal-fired power plants were replaced by natural gas, nuclear power, wind power, and electricity demand reductions.

Between 2003 and 2014, Ontario shuttered 7,546 megawatts of coal-fired capacity and added 13,595 megawatts of new wind, natural gas and nuclear capacity. During that time period, the commodity portion of consumers’ bills increased by 80 percent. It was estimated that eliminating inexpensive coal-fired electricity cost about $5 billion a year.[iv]

The Fraser Institute report examined the impact of closing the coal plants on the level of fine particulates, nitrogen oxides and ground-level ozone in Toronto, Hamilton and Ottawa. The study did not look at greenhouse gases because they are not local air pollutants, and they can be offset globally by purchasing credits elsewhere in the world where the cost may be less to achieve the reduction.

The study determined that the small and, in some cases, statistically insignificant improvements in air quality in a few locations could have been achieved more cheaply with pollution control devices like scrubbers, which would have eliminated 95 percent of the particulate emissions. According to the 2005 Environment Canada Air Pollution Emissions Inventory, residential wood-burning fireplaces, dust from unpaved roads and meat cooking are larger contributors to fine particulate emissions than coal-fired generation.

The Fraser Institute study found that the coal phase-out had no apparent effect on nitrogen oxide levels. However, there was a significant reduction on Ontario ozone levels, which was offset by increased emissions from natural gas power plants that substituted for some of the electricity from the shuttered coal-fired power plants. Per-terawatt, natural gas yields slightly higher net ozone levels.

The study found that the amount of pollution caused by coal-fired plants was not significant enough to be able to obtain the projected benefit in annual health care expenses.[v] According to the study authors, Ontario knew that there would be little net benefit because ample data existed that showed that coal use had little effect on Ontario air quality. Emission inventories from Environment Canada showed that the Ontario power generation sector was responsible for only about

Further, the government claimed that phasing out coal would have a health benefit equivalent to about 10 percent of the health budget. According to the government, coal plant emissions cost the province over $3 billion annually in health-care costs out of a total provincial health-care budget of about $35 billion annually. Thus, the government was attributing almost one-tenth of all health-care spending in the province to illnesses and mortality arising from coal power plants that were responsible for only one percent of annual particulate emissions, which is implausible.

Lesson for the United States

Is the Ontario experience a lesson for the United States?

The Obama Administration concocted the so-called “Clean Power Plan” to reduce carbon dioxide emissions from U.S. power plants. While carbon dioxide is a greenhouse gas and the United States has pledged to reduce its greenhouse gas emissions 26 to 28 percent (compared to 2005) by 2025 as part of the Paris Agreement, other countries, such as China (the world’s largest emitter of greenhouse gases), are committed to releasing more carbon dioxide as they grow their economies through 2030 as part of the Paris Agreement. So, the U.S.’s reduction in greenhouse gas emissions will be countered by increased emissions from developing countries.

The “Clean Power Plan” requires a 32 percent reduction in carbon dioxide emissions (from 2005) by 2030 in the electric power sector. Along with the reduction in carbon dioxide emissions, will be reductions in criteria pollutants that the Fraser Institute evaluated when Ontario shuttered its coal plants. The United States has already seen large reductions in criteria pollutants from other EPA programs while both electricity demand and GDP have increased. (See chart below.) Reducing criteria pollutants results in health benefits that EPA estimates to be $55 billion to $93 billion in 2030. But, those health benefits come at a cost.

Source: EPA

Similar to what occurred in Ontario, implementation of EPA’s Clean Power Plan will result in the shuttering of U.S. coal-fired power plants, replacing them with wind, solar, and natural gas-fired plants. Replacing existing capacity with new capacity means U.S. consumers will pay higher electricity prices, similar to what Ontario electricity consumers faced. An IER study shows that the levelized cost[vii] of new wind capacity is 2.7 times more expensive than the levelized cost of existing coal-fired capacity and the levelized cost of new solar photovoltaic capacity is 3.5 times as expensive as the levelized cost of existing coal-fired capacity.[viii]

Americans will have to pay much higher electricity prices despite the minuscule benefits of the Clean Power Plan, which reduces global carbon dioxide emissions by less than 1 percent and global temperatures by 0.02 degrees Celsius by 2100, according to EPA’s own models. Even EPA Administrator Gina McCarthy admitted the fact when she told Congress that EPA cannot measure the impact of the proposed Clean Power Plan on global temperatures, because it would likely be incredibly small.[ix]

Conclusion

The province of Ontario, Canada decided to shutter their coal-fired power plants in favor of wind, natural gas, and nuclear power, increasing electricity rates to its customers. The Fraser Institute finds that the net benefit in particulate emission reductions could have been achieved less expensively by adding scrubbers to the coal-fired power plants.

The Obama Administration’s “Clean Power Plant” would also prematurely shutter U.S. coal-fired power plants and replace them with wind, solar, and natural gas-fired power plants, raising electricity prices to U.S. consumers. Before following Ontario’s lead, however, the United States should take a closer look at the issues, which the new Trump Administration has promised to do as soon as Oklahoma Attorney General Scott Pruitt is appointed as the Administrator of the Environmental Protection Agency.


[i] Criteria pollutants are sulfur dioxide, nitrogen dioxide, carbon monoxide, ozone, lead and particular matter.

[ii] Fraser Institute, Did the Coal Phase-Out Reduce Ontario’s Air Pollution?, January 17, https://www.fraserinstitute.org/sites/default/files/did-the-coal-phase-out-reduce-ontario-air-pollution.pdf

[iii] Toronto Sun, Shutdown of coal plants raised electricity rates, failed to reduce pollution: Report, January 17, 2017, http://m.torontosun.com/2017/01/17/shutdown-of-coal-plants-raised-electricity-rates-failed-to-reduce-pollution-report

[iv] Toronto Sun, Shutdown of coal plants raised electricity rates, failed to reduce pollution: Report, January 17, 2017, http://www.torontosun.com/2017/01/17/shutdown-of-coal-plants-raised-electricity-rates-failed-to-reduce-pollution-report

[v] CBC News, Closing Ontario coal plants didn’t cut air pollution by much, says Fraser Institute. January 17, 2017, http://www.cbc.ca/news/canada/windsor/coal-plants-closing-ontario-1.3938179

[vi] Fraser Institute, It’s official—Ontario’s coal phase-out was all for nothing, January 17, 2017, https://www.fraserinstitute.org/article/its-official-ontarios-coal-phase-out-was-all-for-nothing

[vii] Levelized costs represent the present value of the total cost of building and operating a generating plant over its financial life, converted to equal annual payments and amortized over expected annual generation from an assumed duty cycle.

[viii] Institute for Energy Research, The Levelized Cost of Electricity from Existing Generation Resources, July 2016, http://instituteforenergyresearch.org/wp-content/uploads/2016/07/IER_LCOE_2016-2.pdf

[ix] Daily Caller, EPA Head Admits Clean Power Plan Wouldn’t Impact Global Warming, April 21, 2016, http://dailycaller.com/2016/04/21/epa-head-admits-clean-power-plan-wouldnt-impact-global-warming-video/#ixzz46UrzwVUT


The post Ontario Achieves Minimal Emission Reductions From Closing Coal Plants appeared first on IER.

ICYMI: Tom Pyle Discusses Keystone XL and Dakota Access on Fox Business

ICYMI: Institute for Energy Research President Tom Pyle recently appeared on Fox Business Network’s Countdown to the Closing Bell with Liz Claman to discuss President Trump’s executive orders to advancing the Keystone XL and Dakota Access pipelines. Watch the clip below:

Click here to read Pyle’s official statement on President Trump’s decision.

###

The post ICYMI: Tom Pyle Discusses Keystone XL and Dakota Access on Fox Business appeared first on IER.

Easy Marketing Investments to Improve Your E-Commerce Store

Posted by KaneJamison

At least once or twice per month, I talk to a small e-commerce store owner who wants to invest in content marketing. Often times, I have to break it to them that they’re not ready for content marketing.

You see, before you spend a bunch of time generating traffic from your target audience, it’s important to make sure those visitors get the best experience possible while browsing your store.

So, in this post, I want to give store owners and e-commerce newbies a clear idea of where they can invest their time before investing in more paid and organic traffic to their sites. Many of these can be accomplished for less than $1,000 or a few hours of your time.

With a few small-scale investments you can help drive performance on conversions, SEO, and more.

So what are they?

  1. Rewrite Your Weak Product Descriptions
  2. Take Better Product Photography
  3. Build Lookbooks & Product Collections
  4. Start Adding Product Videos
  5. Upgrade Your Review Software & Process

Let’s look at these opportunities in detail, and better yet, show you some actual examples of what your site could look like.

Rewrite your weak product descriptions

From product details to features and benefits, product descriptions must pack a lot of information in a short format. You may have overlooked some missed opportunities.

If you answer “yes” to any of the following questions, consider investing in improved product descriptions.

1 - Does your current product page copy speak only to your ideal customer?

If you’ve built buyer personas for your brand, make sure the copy addresses the appropriate persona’s unique pain points and concerns. Bland descriptions meant to appeal to everyone — or just bots — aren’t as effective.

This high chair example from 4moms.com focuses on the three things that matter to their audience: single-handed adjustments, spilt-food prevention, and easy cleanup.

2 - Does your copy focus on benefits rather than features?

You can list features all day long, but customers really want to know how your product will make their life better.

The Amazon Echo sales page does a great job of focusing less on the technical features of the product, and more on the cool things you can do with it.

3 - Are you describing your product with the same words that your customers use?

Using the same language that your customers do will help you better communicate with your target audience in a way that sounds natural for them and touches on their pain points.

A simple way to find these words is to do some reverse engineering. Start by looking at customer reviews and feedback you’ve collected (and those of your main competitors as well) to pick out common words and phrases that satisfied customers are using. From here, you can tie that customer language back into your own descriptions.

I was shopping for a new tent last week and saw this awesome reviewer on Amazon drive home a point that the copywriters had missed. If you read that entire review, the phrase “family tent” is mentioned about 13 times.

But if you read the product description, "family tent" only shows up once. The description fails to mention many of the benefits covered by the reviewer: lots of pockets, sleeping arrangements, ability to catch a breeze but keep the doors closed, etc.

There’s an opportunity here for a competitor in the tent or outdoor space to improve their own product descriptions for the same tent (or even put together a larger guide to family tents).

4 - Are you telling your product’s story?

The folks over at Rogue Brewing understand that the people buying gifts from their website are probably passionate about well-made products, not just well-made beer. Here’s a great example from their site that tells the story of their 28-year search for a decent beer shucker (bottle opener):

Take better product photography

Photography matters. Research from BigCommerce suggests that 67% of consumers consider image quality “very important” when making a purchase online.

Good product photos do more than just show shoppers what you’re selling — they provide context and help customers visualize using your products. Plus, high-quality photos will reduce product returns that happen due to misleading images.

So what can you do to upgrade your product photos?

Smartphones aren't going to cut it

Use a DSLR camera, not your smartphone. Although modern smartphone cameras can take higher resolution photos than ever before, you’ll get better results from a DSLR. Lower-end models start at around $500 — try finding a used body online and spending more money on a better & cost-effective fixed lens that can handle video, too.

Build a cheap lightbox

Create a lightbox for well-lit photos with a solid white background. For less than $10, you can build your own lightbox that will vastly improve the quality of your product images.

Use creative angles

Shoot products from multiple angles. Be sure to include several images on every product page. The more perspectives and viewpoints you have, the better customers will be able to judge your product.

It's OK to tweak & process your images to make them pop

Process your images with filters that enhance color and overall image quality. Photo filters resolve poor lighting or color issues and vastly improve your product photos. Just try not to get carried away with dramatic filters that distort the color of your products, as this can be misleading for the buyer. Here’s a good example from ABeautifulMess.com showing the difference before and after image edits:

If you don’t have time or the inclination to take your own photography, outsource it to a professional. No matter what route you go, know that upgrading your product page photography is well worth the investment.

Build lookbooks & product collections

You can also provide more context for your products through lookbooks, which showcase your products in use. The term “lookbook” is mostly common in the fashion industry, but the concept can be extended to a variety of industries.

The photos in the lookbook for Fitbit’s Alta model of fitness tracker help shoppers envision themselves wearing them. Fitbit’s lookbook also establishes a brand lifestyle promise — impossible with product photos alone. Even better? The various photos are clickable and take you to the product page for that color/style of wristband:

Product collections are another great variation on this strategy. In this “Mediterranean Collection” page on Coastal.com, shoppers get an opportunity to shop by “style,” and to see examples of the glasses on actual faces instead of just a white background:

As I alluded to before, this isn’t just an opportunity for fashion sites. The trick is to make sure you're showing your products in action.

Plenty of other retailers have an opportunity to show off their product in use, like these photos from the Klipsch website showing off their soundbars in various settings:

Car accessories? Same thing.

Heck, even office furniture is easier to purchase when you see how it looks in a workspace.

Start adding product videos

Adding video to product pages is another relatively low-budget improvement you can make, yet it has extreme value for shoppers and your bottom line.

Why? Because video’s ability to quickly educate shoppers is a powerful conversion tool. Eyeview Digital reported that including video on landing pages can improve conversions by as much as 80%, and ComScore indicated that online shoppers are 64% more likely to buy after watching a video.

So how can you put video to work on your product pages?

Whether you’re demonstrating a how-to or simply showcasing a product and outlining product details, adding video on your product pages provides a whole new experience for online shoppers that helps overcome purchase objections and answers their questions.

Video also allows you to give shoppers a more complete overview of the product and to go beyond static pictures with a story element. These engaging visuals can help shoppers envision themselves using your products in a way that photography alone simply can’t.

Zappos is well known for including videos on what seems like every listing, but what’s more impressive to me is how much personality and brand voice they show off. While shopping for boots recently, I have to say Joe was my favorite video personality:

Click image to open product video in a new window.

If you’re up for taking this on with a DIY approach, it’s reasonably easy to create your own product videos at home with the right equipment. Or, outsource this project to a local professional or videographer for hire.

Upgrade your customer reviews software & process

In the current e-commerce landscape, competition is fierce — and there’s always someone willing to deliver cheaper and faster.

That’s why social proof is more important than ever before. Research from eConsultancy shows that 61% of consumers indicate they look to product reviews before making a purchase, and that product reviews are 12x more trusted than product descriptions from companies.

Customer reviews make your product pages more effective, allowing shoppers to evaluate the product based on real customer opinions — and can help you spot product issues.

I’m listing a few common platforms here, but you should really check out Everett Sizemore’s guide to product review software, which has some great insights on the performance of the entire marketplace of product review software options, including technical SEO concerns:

Traditional product reviews may not be right for all stores...

The best option for you will depend on the tool’s ability to integrate with your store, your preferred functionality, and your budget. Sometimes, traditional product reviews won’t be the best choice for your product or store.

In this example from ThinkGeek, they’ve opted to just let people leave Facebook comments rather than any product reviews at all. Which makes sense, because they’re Star Trek garden gnomes, and it’s not like you need to tell people whether they were the right size or not. Even better than Facebook comments, they also solicit product photos via social media on their #geekfamous hashtag.

Here’s another example where my favorite wallet company, SlimFold, simply highlights great product reviews that they received from press and customer emails. While it makes it harder for them to solicit new reviews, they only have a handful of products, and this format allows them to put more emphasis on specific reviews.

There are many different tools that will allow you to showcase elements of social proof like ratings and reviews, so take your time carefully reviewing different options to see which is the best fit for your needs and budget, and if normal product reviews aren’t the right fit, feel free to take a different approach.

Make enough of these small investments and you should see big improvements over the long term.

Tackling these small investments — as your schedule and budget allows — will dramatically improve the overall user experience and the effectiveness of your e-commerce store.

Consider which aspects are the most important to complete first, and then start doing your research and put together a strategy for how you’ll prioritize these site upgrades. With a well-thought-out plan of action, you can focus on the projects that will drive the best results for your business, rather than trying too many different tactics all at once.

Looking for more ideas? Take a look at our guides on product page optimization, category page optimization, and conversion rate improvements for e-commerce.

This is by no means the complete guide to investing in your e-commerce store, so in the discussion below, I’d like to hear from you. What creative ways have you improved your e-commerce site content in the past that boosted conversions or organic search?


Sign up for The Moz Top 10, a semimonthly mailer updating you on the top ten hottest pieces of SEO news, tips, and rad links uncovered by the Moz team. Think of it as your exclusive digest of stuff you don't have time to hunt down but want to read!

Tuesday, January 24, 2017

How to Create Authentic Hyperlocal Content At Scale

Posted by mahannay

The "why" and "how" of sourcing local talent from national HQ

A recent report on national-to-local marketers mentions that, with the exception of email marketing, “enterprise brands are struggling to make digital as effective as traditional tactics and media” for local branches’ ad dollars. With locally focused email newsletters, it’s generally easier to automate locally targeted sales or events. On the other hand, local content is much more essential for local SEO and social media engagement, and this is where enterprise brands have not yet fully conquered the local space.

For national brands, accumulating content that resonates with locals in each individual market is an excruciating task. Not even the best of researchers or the slyest of copywriters can match the value of a local’s knowledge base. Meanwhile, local partners may not have the time or the storytelling know-how to create quality local content.

Content without topic knowledge is generic; content without storytelling chops is ineffective. Herein lies the problem for local: How do you plan quality, shareable articles, videos, and digital media with a local focus at a national scale?

The answer: Find locals to create content about their region.

As Ronell Smith recently wrote, SMBs have the content creation advantage when it comes to local know-how, but I respectfully disagree with Ronell on his preference for local brands topping local content SERPs. Generally, I’d prefer the best local content to top my searches, and many national startups are disrupting local habits for the better (think Uber v. your local cab company). National, online brands will never be able to replace the helpful salesperson down the street, and franchises will never be the first choice for dinner with friends from out-of-town, but there is a space in the market for enterprises, especially if they’re willing to take the time to mingle with local creatives.

The three methods in this post have varying SEO side effects, depending on the tactics used. While local content is a boon to local rank, a “sponsored post” on a local news source won’t have the same effect on your rankings. But while SEO is a factor to consider in content creation, it’s not the only reason in town. Good ‘local’ marketing doesn’t always mean scaling standardized national content and messaging to every market; rather, this post posits that ‘scaling local’ means developing targeted resources that resonate in each market.

1. Patronize local media

PR is not the only way to work with journalists anymore. Many media publications both large and small are adding content creation services to their revenue stream. Sometimes this means sponsored content, where a piece is commissioned (and labelled as such) by a for-profit partner. In other cases, journalists are working with brands to bring their talent for story to commercials, website content, or other branded media.

According to a 2014 Pew Research report, “the largest component of the growing digital news world is the smaller news site. A large majority of them are less than a decade old, about half are nonprofits, most have staffs of five or fewer and many also rely on volunteer and citizen contributors. Their greatest area of focus is local news coverage.”

One such example at the local scale is Bit & Grain, a North Carolina-focused long-form publication, whose pieces are supported by its founders’ storytelling productions for brands and nonprofits. I spoke with the weekly publication’s three cofounders on their revenue generation experiences, 18 months post-launch.

Cofounder Ryan Stancil explained that they’re still experimenting with revenue generation models, but that content production and creation is their most successful funding tool so far.

“People need help telling their story,” Stancil said. He added that their work-for-hire is both very different and very similar to the pieces they create for Bit & Grain. It’s different in that it’s commissioned storytelling, but it’s the same level of quality they bring to their weekly pieces.

A sampling of Bit & Grain’s local fare.

Stancil brought up their recent sponsored piece on a local restaurant as an example. While clearly labelled as “sponsored content,” the piece received the same aesthetic care and storytelling craft as any article in the publication. Stancil’s cofounder, Baxter Miller, echoed a similar sentiment in their sponsored content process.

“If anyone came to us about doing a sponsored content piece, we would vet them as much as anything we put on our editorial calendar,” she said “And really the process is much the same.”

I also spoke with Shawn Krest, the managing editor of local publication Raleigh & Company, which began as a fun side project/playground for Raleigh, NC-area journalists and has evolved into a blog-like online publication. The site was acquired by Capitol Broadcasting Company in August of 2015.

While Raleigh & Company covers the same region as Bit & Grain, the publications’ similarities end there. Raleigh & Company’s subject matter is more irreverent, with pieces poking fun at Presidential candidates, and others interviewing NFL recruits who will never see game day. Plus, Raleigh & Company’s copyeditors have no qualms about the first person appearing in its columns.

“We’ve had pieces where writers really open up and talk about issues they’re dealing with,” Krest said. “Addictions, things like that. I feel like when Raleigh & Company is at its best, you see the writer sort of bleeding on the keyboard as they’re writing.”

Local journalism is going niche in a way that daily newspapers couldn’t. For brands, this is another potential win, as you’re able to zero-in on a narrow audience in your city of choice.

Like Bit & Grain, Raleigh & Company is open to sponsored posts, but Krest is not willing to lose the tenor of the publication to satisfy a sponsor, as he explained when the blog was acquired by Capitol Broadcasting Company.

“We said at that first meeting, ‘we use the F-word and we’re not going to stop,’ and they were fine with that,” he said. “The first time they wanted us to look more like the local news, it would not work."

While as different as Eastern and Western NC barbecue, Bit & Grain and Raleigh & Company have similar limitations to their branded content philosophies. This shouldn’t be a problem for companies seeking true neighborhood flavor in their local content. For brands who want a bit more control, a collaborative approach with an influencer may be a better option.

Finding local journalists

Local media is transforming. For some, this is a frightening prospect; for others, it’s a moment of opportunity. During the recent Sustain Local Journalism conference, which I attended, a few local writers and publishers gathered in Montclair, NJ to discuss the biggest issue currently haunting their industry: how to keep funds flowing. While some local news sites, such as Philadelphia’s Billy Penn, have found success through events, many at the conference agreed that revenue diversification was the only way forward. Not every local writer will want to craft a piece for a brand, but others are willing to work with the enterprise in order to support their own local efforts.

Here are a couple online lists of local media sites:

Though both lists fall short of the total, as neither has Bit & Co. or Raleigh & Company among their publications.

2. Capture the photographer next door: Partner with local influencers

Influencer marketing is nothing new, but it is under-utilized for local campaigns. Whether they’re Insta-famous or a YouTube personality, every influencer calls somewhere home. And for local content creation, audience size is a secondary metric. The biggest offering local bloggers or vloggers provide is a local perspective and content creation experience.

My favorite rule of thumb when approaching bloggers (credit to a presentation by Molly McKinley of Adwerx): Give before you ask.

And "gifts" don’t have to be free products. They don’t even have to be physical items. Can you invite local bloggers to an upcoming company event? Do local offices receive event tickets in exchange for local sponsorships? Maybe you could allocate a budget to sponsor their existing local interests. For enterprise-size brands, links and shares of smaller bloggers can offer a big boost to their SEO and/or social media accounts. At ZipSprout, we’ve developed locally focused content by interviewing bloggers about their favorite area restaurants and day trips.

Local bloggers have both neighborhood and content creation know-how. While your competitors chase the influencers with the biggest following, consider first seeking the voice that matches your brand.

Finding local influencers

Bloggers and influencers are typically organized categorically, so I have to go back to some of the prospecting lessons I learned from my cofounder, link builder Garrett French, to find influencers based on location.

I find success using phrases a local would have on their blog, such as:

"here in philadelphia" intitle:"blog"

From which I found:

Sometimes it helps to get a bit more specific, since many bloggers don’t have the word “blog” on every page. So I tried:

"here in philadelphia" intitle:"my dog"

From which I found:

Want a local photographer? Try:

"here in philly" inurl:"instagram.com"

Photo by @bkerollis, a Philadelphia-based blogger and choreographer, on Instagram.

Of course, you can search for #Philadelphia on Instagram, but Google conveniently sorts (somewhat) by post popularity.

3. Brand Y x City Z = Local data

It’s not just “the top 10 cities for” — find local data in context with national trends. Good narratives find the context and connection to bigger stories. What does your data from City X say about how that area stands out from the crowd?

At ZipSprout, we’ve reported on the top corporate sponsors in a particular geographic region, finding that local news and tech companies, followed by national banks, are the most widespread donors to local nonprofits and events in Raleigh/Durham, North Carolina. We also visualized the most frequently used words in local organization’s "about" pages. Thanks to our data, we can write a similar article, but with very different results, for cities all over the U.S.

It can take some developer time, but local data can be automated on city pages. What’s the most popular Starbucks order in Omaha, Nebraska? What’s the most frequently rented Hertz car from the Dallas/Fort Worth airport? What are the most and least popular times to ride a Lyft in NYC?

Locally focused blog posts and landing pages can be fun. Showing customers we know they’re unique says a lot about a brand’s local presence, without saying anything at all.

Conclusion: Write local, right

If you really want to have hyperlocal visibility, in the SERPs and in local publications, you need hyperlocal content, at scale.

The Woodward and Bernstein-style newsroom may soon be old fashioned, but we’re also in an age that appreciates authentic, quality storytelling, and local branches often don’t have the personnel or resources to develop local content. Neighborhood know-how can’t be fudged, so why not partner people who can tell your brand’s story with a local accent?


Sign up for The Moz Top 10, a semimonthly mailer updating you on the top ten hottest pieces of SEO news, tips, and rad links uncovered by the Moz team. Think of it as your exclusive digest of stuff you don't have time to hunt down but want to read!