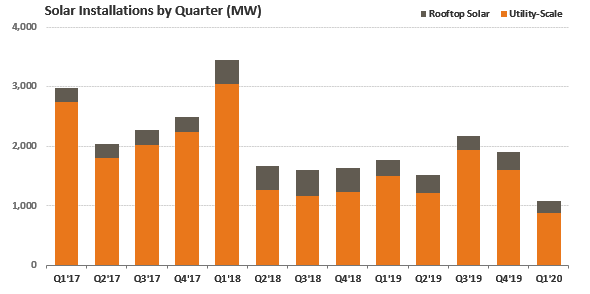
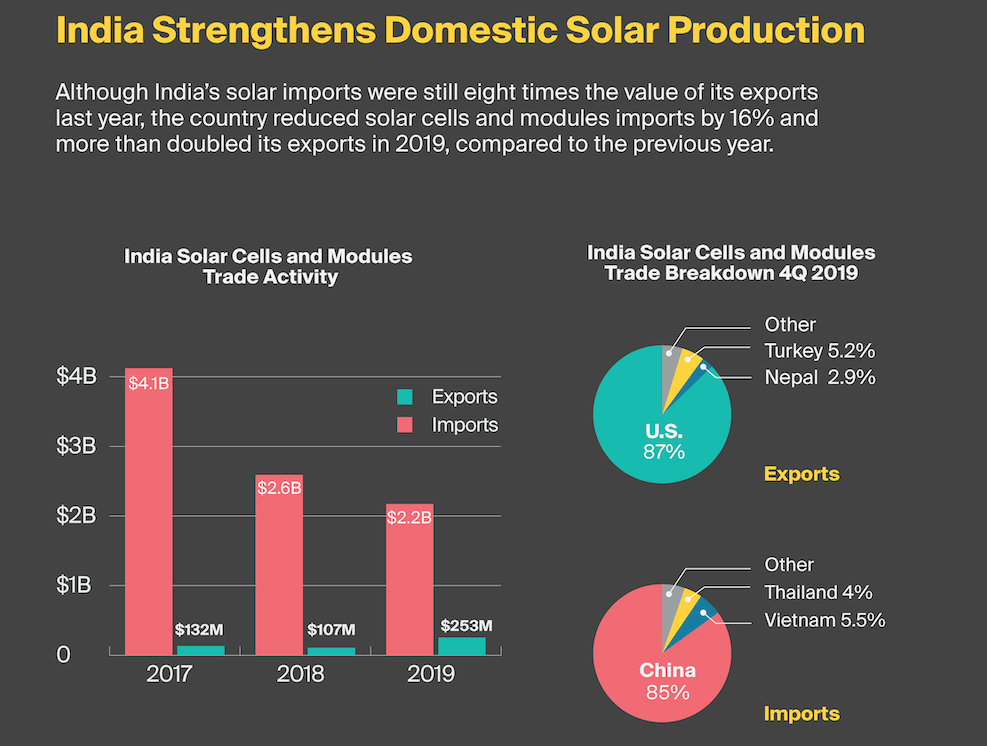
India has a goal of installing 100 gigawatts of solar power by 2022 , or slightly less than 10 percent of the generating capacity of the entire U.S. grid. India currently has 36.8 gigawatts of installed solar capacity with another 36.9 gigawatts in the pipeline. However, it is expected that solar installations will total only about 5 gigawatts this year mainly because of delays caused by the coronavirus pandemic. Currently, India imports about 85 percent of its solar modules and cells from China. An additional 5.5 percent are imported from Vietnam and 4 percent from Thailand, but those companies are mostly controlled by China. Disruptions caused by the coronavirus pandemic resulted in India’s first-quarter 2020 solar installations (1,080 megawatts) to be the lowest since 2016, dropping 39 percent from a year earlier (1,761 megawatts).
As a result, Prime Minister Narendra Modi announced a national strategy called “Atmanirbhar Bharat,” or “Self-Reliant India” to scale up India’s manufacturing capacity. The late start will allow India’s manufacturers to adopt the latest technology to make high-end products, such as high-efficiency solar cells.
In June, India announced that it would impose duties of up to 25 percent on solar modules and a 15 percent tariff on solar cells from China and Chinese-controlled companies. The duties are a continuation of taxes that were levied starting in 2018 to protect domestic manufacturers of solar parts. There are plans to increase these taxes after one year.
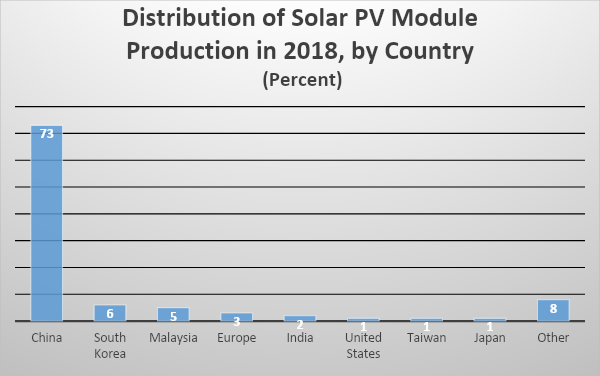
When Chinese companies first began making solar panels, they bought manufacturing equipment from Germany and Japan, gradually replacing it with domestic equipment that performed the same function. They now have supplanted international rivals and command a dominant position in the global market due to massive amounts of investment that have increased production and driven down costs. Eight out of the world’s top 10 solar panel makers are Chinese. China is by far the world’s biggest producer with a 73 percent market share. Second-ranked South Korea has 6 percent of the market.
Longi Solar, the world’s sixth-largest solar panel maker, is based in Taizhou, about 200 kilometers northwest of Shanghai. Because Longi specialized in making the high-performance monocrystalline silicon used in industrial-grade panels for solar power plants, it could channel its revenue from its silicon materials business into solar panel factories, allowing it to become the number 6 panel maker globally in only four years. The company’s 146,000-square-meter (1.57 million square foot) plant began operating in 2016. The plant can turn out 4 million kilowatts worth of panels a year–about 70 percent of Japan’s annual demand. Most of the work at the plant is done by machine, allowing most of the factory’s 600 workers to be engaged in quality control and inspection of the finished products. Longi plans to increase its production capacity about fourfold to 30 million kilowatts by the end of 2021.
In 2011, China introduced a feed-in tariff for renewable energy, which helped to develop its solar panel market. The country accounts for about half of global solar panel demand. China and Japan, however, have largely ended the subsidized rates at which solar energy was sold to utilities, while many industrialized countries continue to provide subsidies for solar power, including the United States and many U.S. state governments. The United States and India have imposed tariffs on Chinese solar panels, which has helped to stop the flood of imports from China.
Recent Developments Increased Chinese Module Prices
Prices of China’s solar modules have increased for the first time since 2017 because of the closure of two Chinese manufacturing plants due to an explosion at one and flooding at another. The cost of a single multi-crystalline solar module increased to over $17 Rupee ($0.23 U.S.) from $16-16.5 and the price of a mono-crystalline module increased to between $18 and $19 Rupee from about $17.5. The equivalent tariff impact on new projects is estimated at about 0.07 Rupee per kilowatt hour ($0.001 U.S.). The increase in prices came as a surprise since solar module prices had been consistently decreasing. As with everything else, they were bound to eventually increase, but the Indians found themselves at the whim of Chinese manufacturers on whom they now depend for 85 percent of their solar equipment.
As a result, Chinese module suppliers are reneging on signed contracts unless higher prices are paid.
Conclusion
The solar module supply chain is controlled almost entirely by China, who has 73 percent of the world market, and Indian solar developers are left with no option but to buy from them. The solar industry in India is procuring modules from the Chinese because presently there is no other option. But, India’s prime minister Modi wants to change that and develop a solar manufacturing industry domestically. He has imposed duties on solar modules and cells from China, which may slow the country’s transition to solar energy. Duties are part of a wide range of Indian government actions aimed at building domestic manufacturing and becoming less energy-dependent upon China.
If your websites are like most, they include a fair amount of extra "stuff" in the title tags: things like your brand name or repeating boilerplate text that appears across multiple pages.
Should you include these elements in your titles automatically?
To be fair, most sites do.
Alternatively, could it help your SEO to actually include less information in your titles? (Or at least in specific circumstances?)
We know from a handful of studies that titles of a certain length tend to perform better. A now-famous study from the engineers at Etsy showed how shorter titles performed better than longer ones. SEOs speculate that this could be because shorter titles can have more focused relevancy (by focusing on core keywords), might earn higher click-through rates, or some other reason we can't imagine.
When choosing which part of a title to shorten, brand names and boilerplate text are obvious choices. But how do you determine if this is something you should consider for your own SEO?
Here's an example of a brand's site name at the end of every title:
We've all seen sites like this. Heck, most of us do this on our own sites. The question is, does having our brand/site name at the end of every title actually help, or hurt?
But first, we also have to consider other types of boilerplate.
What is boilerplate? Boilerplate simply means standardized, non-unique pieces of text that are used over and over again. This often includes things like categories, product categories, author tags, and taglines.
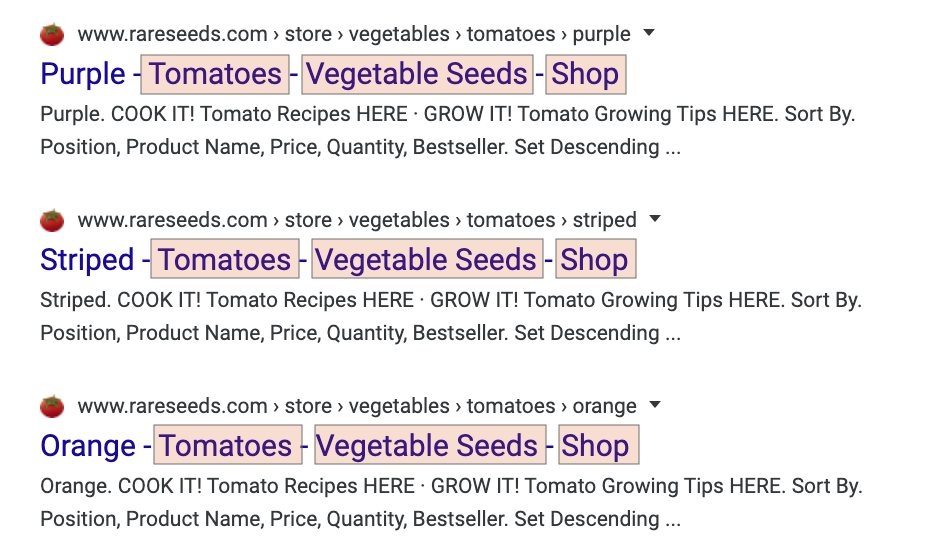
In this example below, the boilerplate text on every title includes "Tomatoes - Vegetable Seeds - Shop."
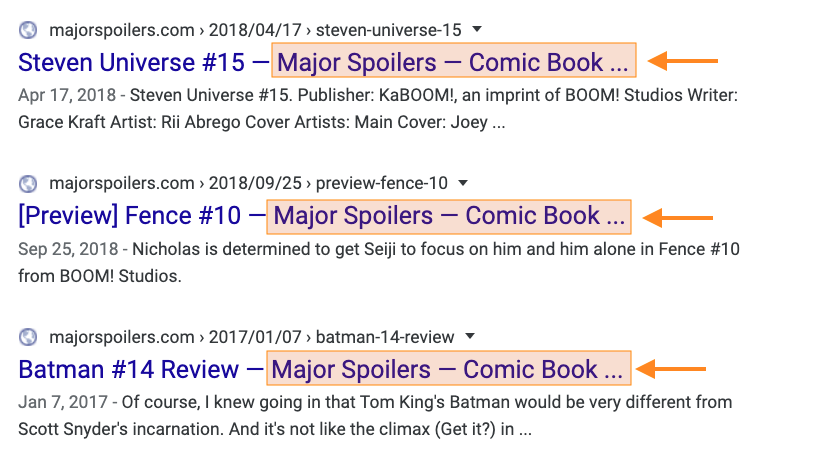
Sometimes boilerplate material can become quite long. The comic book review site Major Spoilers (awesome name!) often includes the same 65-character boilerplate on many pages:
"Major Spoilers – Comic Book Reviews, News, Previews, and Podcasts"
Of course, at this length, it's so long that Google truncates every single title:
The problems that boilerplate can cause your SEO are threefold:
Relevancy: Unnecessary words can make your title less relevant, both to search engines and users. For search engines, this could mean lower rankings. For users, this could result in fewer clicks.
Uniqueness: Titles that share the same repeating text, and only vary from one another by a word or two, aren't very unique. While this isn't necessarily a problem, it goes against most SEO best practices, where uniqueness is key.
Length: Boilerplate means you have less room to display other words in your title, and Google will often cut these off if they go beyond a certain length.
Experiment #1: Remove category from title
We decided to run a couple of boilerplate experiments here at Moz, to see if we could increase our rankings and traffic by removing some of the repeating parts of our titles.
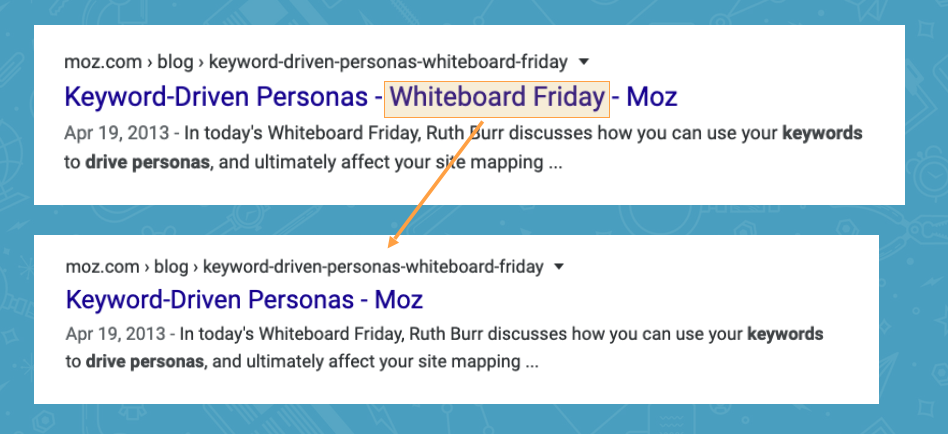
We started with our Whiteboard Friday blog posts. Every time Moz publishes a new Whiteboard Friday, we traditionally include "Whiteboard Friday" in the title.
What would happen if we removed this from the titles?
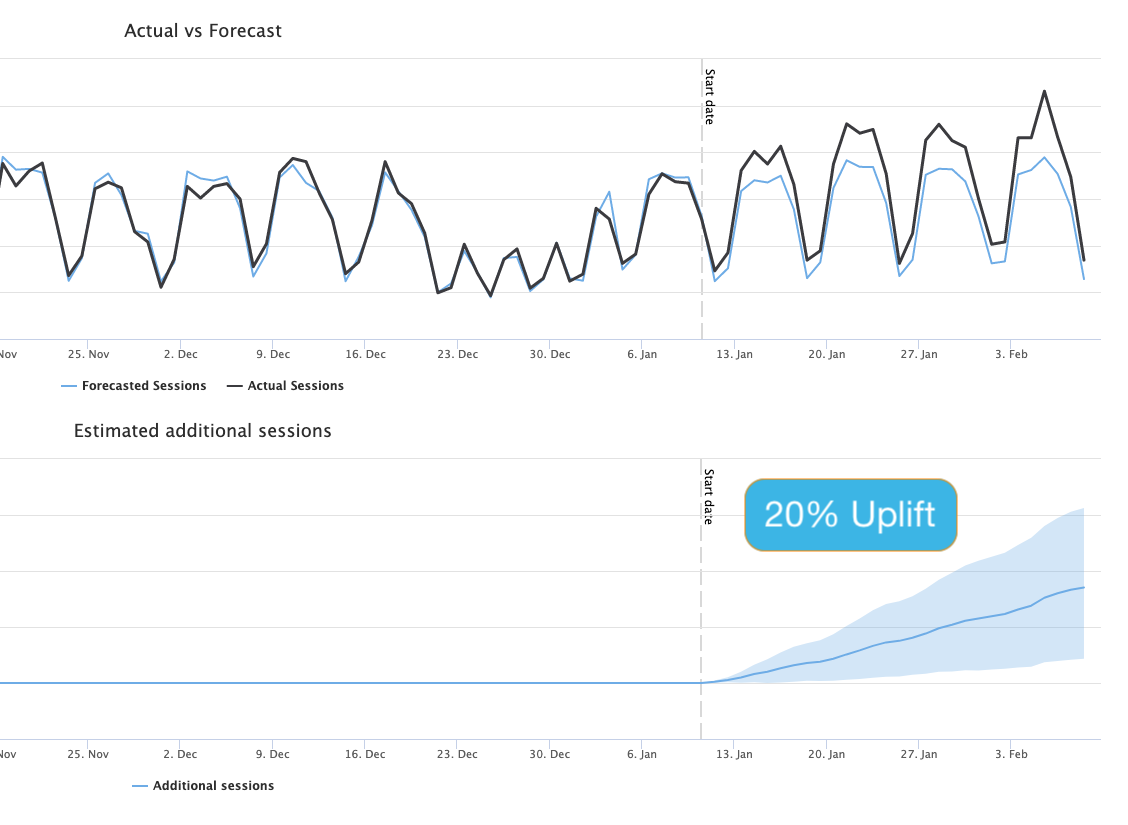
Using an A/B split test methodology — where we rolled the test out on 50% of the titles and used the other 50% as a control — we saw an amazing 20% uplift from this experiment.
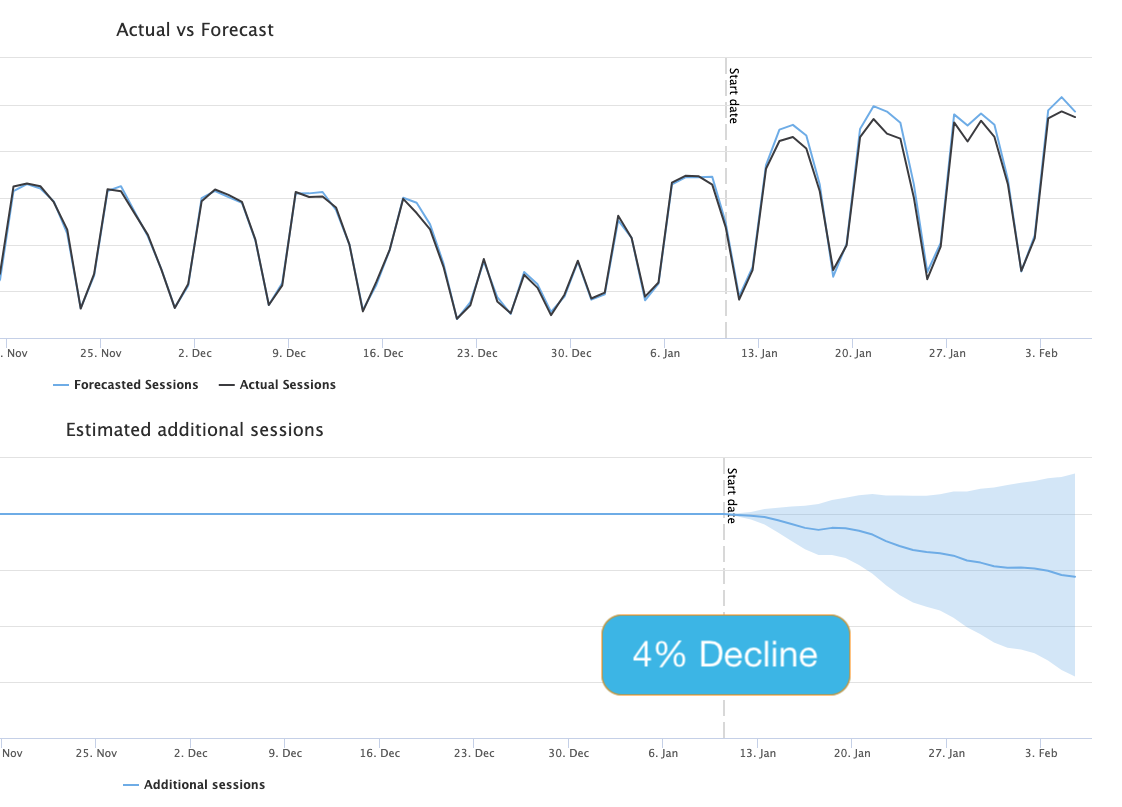
This chart represents the cumulative impact of the test on organic traffic. The central blue line is the best estimate of how the variant pages, with the change applied, performed compared to how we would have expected without any changes applied. The blue shaded region represents our 95% confidence interval: there is a 95% probability that the actual outcome is somewhere in this region. If this region is wholly above or below the horizontal axis, that represents a statistically significant test.
Honestly, the results surprised us. Whiteboard Friday is a popular brand (so we thought) but removing this boilerplate from our titles produced a significant uplift in traffic to those pages.
At this point, we got cocky…
Experiment #2: Remove brand from title
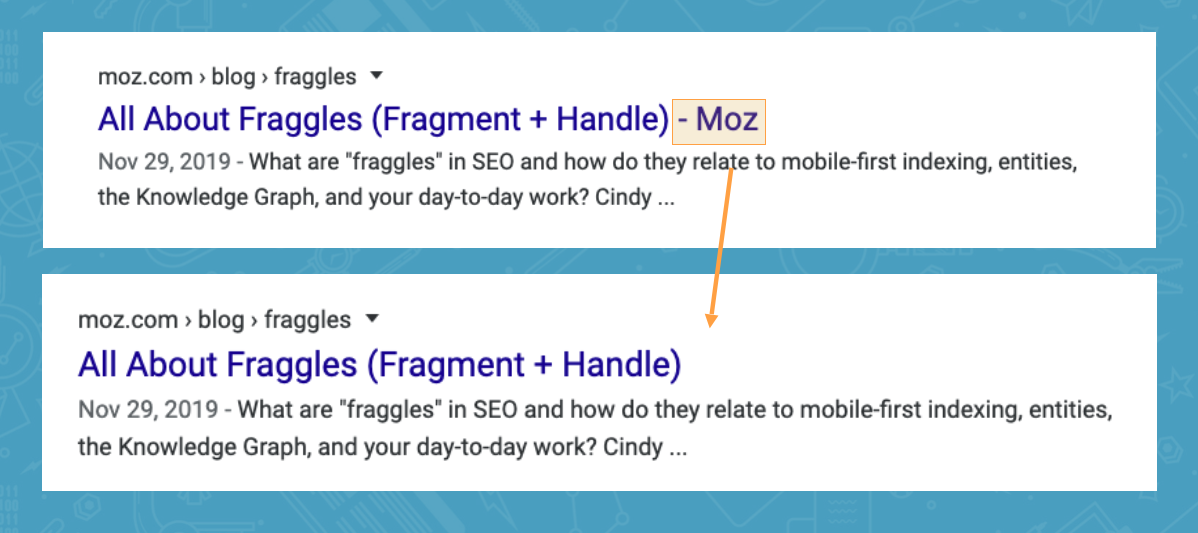
If removing the category name from Whiteboard Friday posts produced such a significant uplift, what if we removed our brand name from all titles?
For this A/B experiment, we did exactly that—removing the word "Moz" from 50% of our titles and measuring the results.
Crazy, right? If it worked by removing "Whiteboard Friday" would we see the same uplift by removing "Moz?"
Sadly, Google had other plans:
While this A/B test never reached full statistical significance, we actually saw a 4% decline in traffic by removing our brand from our title tags.
Boo!
So why did this test not produce the same gains? To be honest, I've removed the brand name from other site's titles and seen as much as a 20% uplift.
It turns out that whether or not removing brand/boilerplate will be beneficial to your SEO depends on a few key factors, which you can gauge in advance.
How to know if removing boilerplate may succeed
Over 10 years of experience and literally millions of title tags, I've found that there are basically four factors that influence whether or not removing boilerplate from your titles might be beneficial:
Brand Strength: Popular brand names in titles almost always perform better than unknown brands, even when people aren't searching for your brand specifically. Amazon's brand recognition, for example, likely gives a significant boost to including "Amazon" in every title, even when people aren't specifically searching Amazon. Less recognizable brands, however, don't always get the same boost, and can actually lead to fewer visits based on relevancy, length, and clickability (described next.)
Relevancy: Are your boilerplate/brand keywords relevant to what your users search for? For example, if you're site is about television repair, then boilerplate titles that say "Brad's TV Repair" are going to be much more relevant than boilerplate that simply say "Brads." (We'll explore a way to determine your boilerplate's brand strength and relevancy in the next section.)
Length: In general, long boilerplate has the potential to do more harm than short boilerplate/brand words. Long boilerplate can dilute the relevance of your titles. So if you include "Buy Brad's TVs, Television Repair, High Definition Servicing, Audio and Visual Equipment for Sale in Houston Texas and Surrounding Areas" - you may want to rethink your boilerplate.
Clickability: Sometimes, boilerplate can make your titles more clickable, even if they aren't terribly relevant. Words like "Sale", "Solved", "Free", "2020", "New", and many others can lead to an increase in click-through rates (CTR.) Sometimes you can't tell until you test, but in many cases even adding clickable elements to your boilerplate can lead to significant gains.
Simple technique for determining your brand strength and boilerplate relevancy
This simple technique will also show why removing "Whiteboard Friday" led to an increase in traffic while removing "Moz" from titles did not.
Here's what you want to do: for each piece of boilerplate, determine the number of URLs on your site that rank/receive traffic for those keywords.
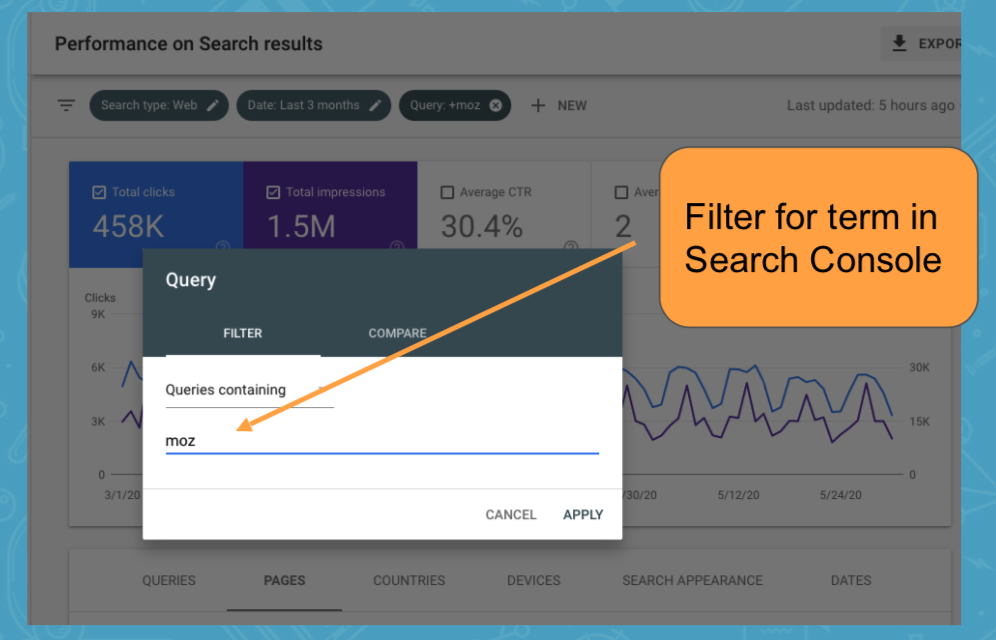
Simply enter your boilerplate/brand as a query filter (you may need to break it into chunks for longer boilerplate) and see how many URLs receive traffic for queries that include that keyword.
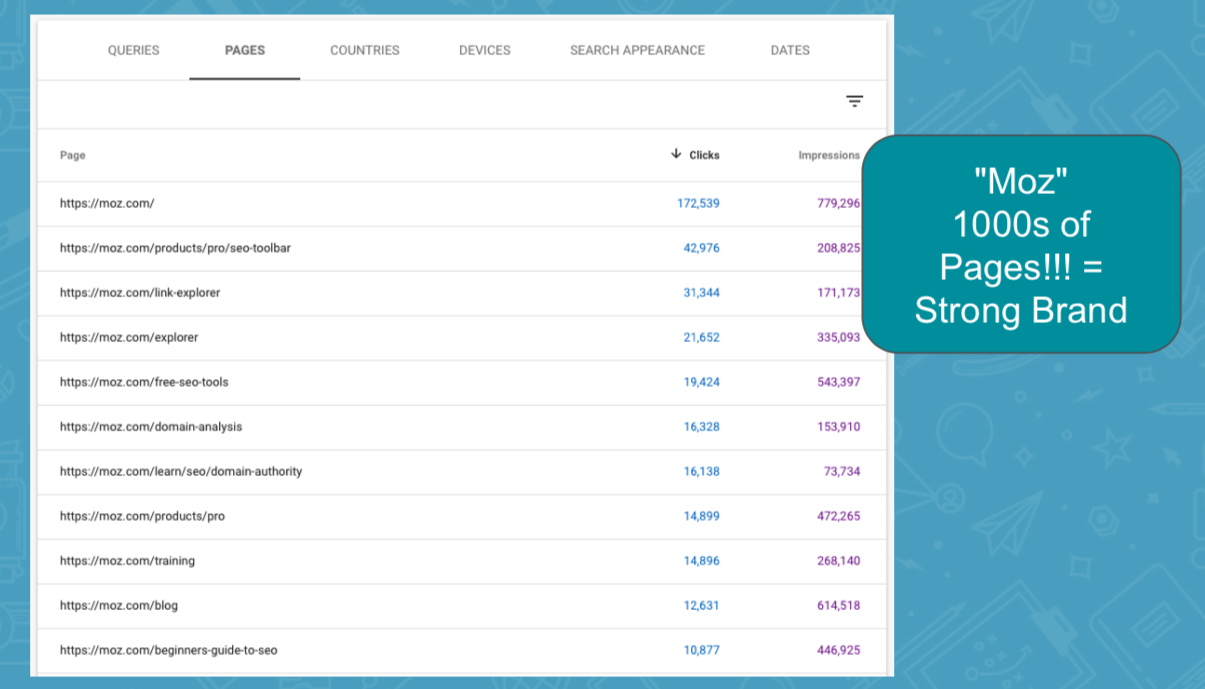
When we filter for keywords that contain our "moz" brand name, we find thousands of ranking URLs.
People are searching for things like:
Moz DA Checker
Moz Pro
Moz SEO
Moz Blog
Etc., etc.
As our brand name is part of so many queries and leads to visits across thousands of pages, this tells us that "Moz" is a very strong brand, and we'd likely be smart to include it as part of our title tags.
"Moz" is also very short at only 3 characters, which doesn't hurt either.
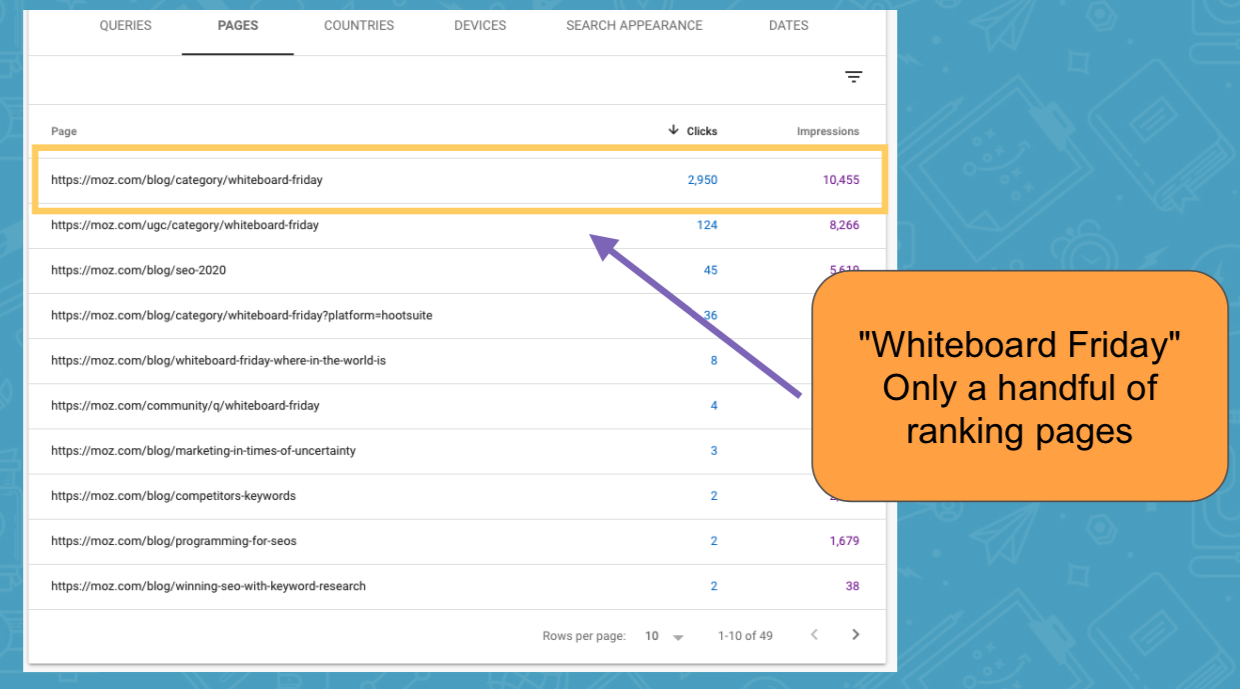
So what happens when we try this same technique with "Whiteboard Friday" — the boilerplate that led to a 20% uplift when we removed it? We see a very different result:
In this case, almost all the traffic for "Whiteboard Friday" search terms goes to only one or two pages.
For most Whiteboard Friday posts, the term is simply irrelevant. It's not what people are searching for, and the brand isn't strong enough to produce additional uplift.
Also, at 17 characters long, this boilerplate added significant length to each of our titles, in addition to possibly diluting the relevancy for what the posts were ranking for.
Final thoughts + bonus free title tag webinar
These tips can't tell you definitively whether you should or shouldn't include boilerplate or brand in your title tags, but they should give you a pretty good idea of when you should test things out.
Remember: Always test and evaluate before making any SEO change permanent. At least know the impact of the change you are making.
Also, please don't be under the impression that you should always remove boilerplate from your titles. In some instances, actually adding boilerplate can produce an uplift, particularly when the boilerplate is:
Recognizable: For example a strong brand
Relevant: The right keywords
Clickable: Encourages a high CTR
Succinct: Not overly long
If you found value in the tips, and want to learn even more ways to optimize your title tags, we've made available a free webinar for you: SEO Master Class: Advanced Title Tag Optimization (For Any Site).
If you've got 40 minutes, it's definitely worth a watch.
Sign up for The Moz Top 10, a semimonthly mailer updating you on the top ten hottest pieces of SEO news, tips, and rad links uncovered by the Moz team. Think of it as your exclusive digest of stuff you don't have time to hunt down but want to read!
California set its first renewable portfolio standard in 2002 and currently requires 60 percent of its generation to come from renewable energy by 2030 with the next 40 percent of generation to come from zero-carbon sources by 2045. These non-carbon sources will likely be wind, solar, geothermal, and hydropower. California is shuttering its last nuclear plant in the next few years and new nuclear cannot compete economically with these other non-carbon sources.
During a recent heat wave, California was forced to implement rolling blackouts because it had insufficient power to meet demand when its solar generation declined in the evening, Normally, it purchases power from neighboring states when this occurs, but those states did not have extra power to sell due to the heat wave. California got caught because it had retired many natural gas and nuclear plants, and did not have sufficient back-up power to fill in when its intermittent renewables could not find enough sun or wind to continue operating.
Democratic Party presidential nominee Joe Biden, if elected, will be forcing the rest of the country into a similar plight with his “clean energy standard,” which requires 100 percent electricity to be generated from non-carbon sources by 2035. Whether it is even feasible on a national scale is doubtful, but it will undoubtedly be expensive to electricity consumers and to taxpayers.
Electricity Prices
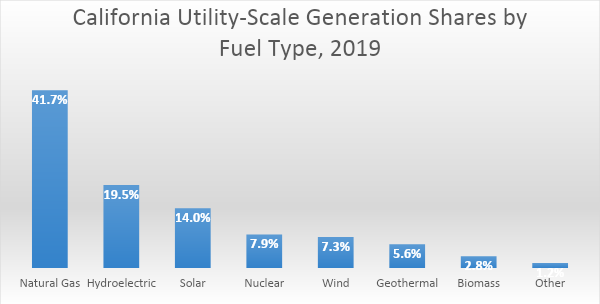
While electricity production from fossil vs. renewable sources varies by state, the energy decisions that each state makes ultimately affect the price of generation and costs to consumers. For instance, Massachusetts had the third highest residential electricity price in the nation in 2019 mainly due to the lack of natural gas pipeline infrastructure, but also due to the premature retirement of fossil fuel generating capacity. California had the seventh highest residential electricity price in the nation in 2019 because of their zeal for carbon free and non-nuclear generating capacity. In 2019, 30 percent of California’s utility-scale electricity came from non-hydroelectric renewable energy, including 5.6 percent that came from industrial geothermal production, in which California leads the nation with 70 percent of U.S. geothermal production. Including hydroelectricity, 49 percent of the state’s utility-scale power was generated by renewable energy in 2019. (See graph below.)
California is not the only state pursuing an all carbon-free and mainly renewable electricity future. In New York, Governor Cuomo has called for the expansion of the state’s “clean energy standard” so that 70 percent of New York’s electricity comes from renewable energy sources such as solar and wind by 2030, followed by 100 percent carbon-free electricity by 2040 and an 85 percent reduction in greenhouse gas emissions by 2050 under the Climate Leadership and Community Protection Act. New York is shuttering the Indian Point nuclear plant that supplies power to New York City—one unit was closed in April and the second unit will be shuttered next April. By shutting down just one of Indian Point’s two reactors this year, New York lost more carbon-free electricity than produced annually by every wind turbine and solar panel in the state. New York still needs to figure out how to replace their output.
One project currently under negotiation in New York is the Champlain Hudson Power Express transmission line, which is expected to deliver 24,000 megawatt hours of hydropower daily through a transmission line that runs from Québec, Canada to New York City. However, environmentalists are calling for the city to scrap the project because of concerns about the environmental impacts of the transmission line that include the potential creation of new dams in Québec and the impact of the transmission line cable that will be buried into the Hudson River’s riverbed.
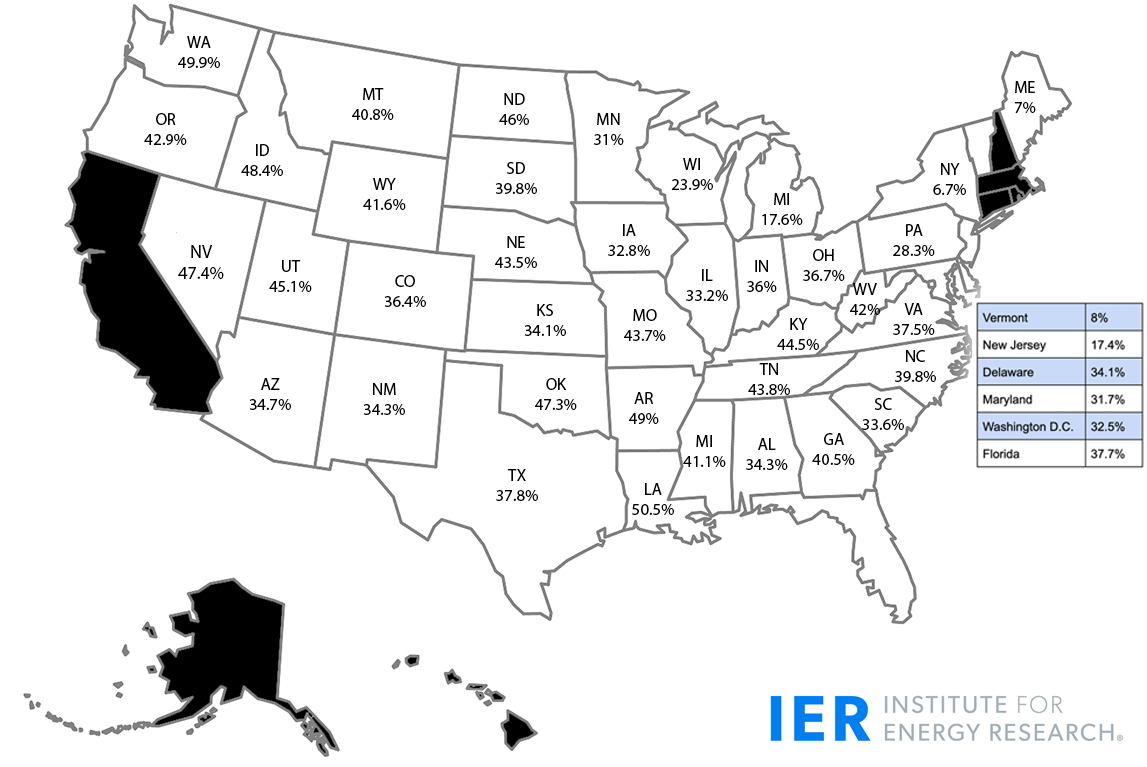
New York has the eighth highest average residential electricity price in the nation and shuttering Indian Point will only raise it. But, thankfully for consumers, not all states are following California’s and New York’s lead. The following map depicts the 43 states that have lower residential electricity prices than California and provides how much lower their residential electricity price is relative to that of California’s price. For example, New York’s average residential electricity price in 2019 was 6.7 percent lower than California’s in 2019. California’s average residential electricity price was 32 percent higher than the nation’s average residential electricity price in 2019.
Residential Electricity Prices Relative To California
Note: The states depicted in black are California and the 6 states that had higher electricity prices in 2019 than California.
Not all states are endowed with renewable resources, such as the southeast where wind resources are poor. As a result, one size does not fit all and using California’s electricity system as a pattern for the nation, as Joe Biden is doing, is not beneficial to Americans for it will only increase electricity prices in the 43 states that have lower prices than California.
Conclusion
Americans need to see where Joe Biden and his party platform are taking the nation with their Green New Deal Clean Energy Standard. Americans complain if legislators torque their gasoline prices, but they should also keep an eye on policies that will increase their electricity prices and threaten the competitiveness of their businesses because these will not only affect their pocketbooks as consumers, but also as taxpayers since Biden indicates he needs $2 trillion—to start! If energy is made too expensive in the United States for businesses to produce things domestically, they will move to places that do not have such policies, taking jobs and opportunities with them. With American companies finally moving jobs back to our own shores, now is not the time to artificially increase the cost of energy in the United States.
Contrary to popular belief, SEO and PPC aren't at opposite ends of the spectrum. There are plenty of ways the two search disciplines can work together for benefits all around, especially when it comes to optimizing your Google Ads. In this informative Whiteboard Friday episode from last Spring, MozCon speaker and Kick Point President Dana DiTomaso explains how you can harness the power of both SEO and PPC for a better Google experience overall.
Click on the whiteboard image above to open a high-resolution version in a new tab!
Video Transcription
Hey, Moz readers. My name is Dana DiTomaso, and I'm President and partner at Kick Point. We're a digital marketing agency way up in the frozen wilds of Edmonton, Alberta. Today I'm going be talking to you about PPC, and I know you're thinking, "This is an SEO blog. What are you doing here talking about PPC?"
But one of my resolutions for 2019 is to bring together SEO and PPC people, because SEO can learn a lot from PPC, and yes, PPC, you also can learn a lot from SEO. I know PPC people are like, "We just do paid. It's so great." But trust me, both can work together. In our agency, we do both SEO and PPC, and we work with a lot of companies who have one person, sometimes two and they're doing everything.
One of the things we try to do is help them run better Ads campaigns. Here I have tips on things that we see all the time, when we start working with a new Ads account, that we end up fixing, and hopefully I can pass this on to you so you can fix it before you have to call an agency to come and fix it for you. One of the things is this is actually a much longer piece than what I can present on this whiteboard. There's only so much room.
There is actually a blog post on our website, which you can find here. Please check that out and that will have the full nine tips. But I'm just going to break it down to a few today.
1. Too many keywords
First thing, too many keywords. We see this a lot where people, in Google it says make sure to put together keywords that have the same sort of theme.
But your theme can be really specific, or it can be kind of vague. This is an example, a real example that we got, where the keyword examples were all lawyer themes, so "defense lawyer," "criminal lawyer,""dui lawyer," "assault lawyer," "sexual assault lawyer." Technically, they all have the same theme of "lawyer,"but that's way too vague for it to be all in one single ad group, because what kind of ad are you going to show?
"We are lawyers. Call us." It's not specific enough. Take for example "dui lawyer,"which I know is a really very competitive niche, and then you can do [dui lawyer], [dui lawyer seattle], and then "dui lawyer" and +dui+lawyer+seattle spelled out a little bit differently. I'll talk about that in a second. By taking this one thing and then breaking it down into a much more specific ad group, you can really have much more control.
This is a consistent theme in all the tips I talk about is much more control over where you're spending your money, what keywords you're spending it on, what your ads are, having a much better landing page to ad match, which is also really important. It just makes your ad life so much easier when you've got it in all of those ad groups. I know it might seem intimidating. It's like, "Well, I have three ad groups now.If I follow your tips, I'm going to have 40."
But at the same time, it's way easier to manage 40 well organized groups than it is to manage 3 really badly organized groups. Keep that in mind.
2. Picking the right match type
The next thing is picking the right match type. You can see here I've got this bracket stuff and this phrase stuff and these plus signs. There are really four match types.
Broad match
There's broad match, which is terrible and don't ever use it. Broad match is just you writing out the keyword, and then Google just displays it for whatever it feels like is relevant to that particular search. For example, we've seen examples where it's like a catering company and they'll have "catering" as a keyword, and they're showing up for all sorts of phrases in catering where they can't provide catering, so searching for a venue that only does in-house catering. Or they're spending money on a catering conference or just totally irrelevant stuff. Do not use broad match.
Broad match modifier (BMM)
The upgrade from that is what's called broad match modifier or BMM, and that's where these plus signs come in. This is really the words dui, lawyer, and seattle in any order, but they all have to exist and other things can exist around that. It could be, "I need a DUI lawyer in Seattle." "I live in Seattle. I need a DUI lawyer." That would also work for that particular keyword.
Phrase match
The next type is phrase, and that's in the quotes. This "dui lawyer" is the example here, and then you can have anything before it or you can have anything after it, but you can't have something in between it. It couldn't be "dui who is really great at being a lawyer" for example. Weak example, but you get the idea. You can't just shove stuff in the middle of a phrase match.
Exact match
Then exact match is what's in the brackets here, and that is just those words and nothing else. If I have [dui lawyer], this keyword, if I didn't have [dui lawyer seattle], this keyword would not trigger if somebody searches [dui lawyer seattle]. That's as specific as possible. You really want to try that for your most competitive keywords.
This is the really expensive stuff, because you do not want to waste one single penny on anything that is irrelevant to that particular search. This is your head on, it's really expensive every click. I've got to make sure I'm getting the most money possible for those clicks. That's where you really want to use exact match.
3. Only one ad per group
Next, tips. The next thing is what we see is a lot of people who have only one ad per group.
Have at least 3 ads per group
This is not a tip. This is a criticism up here. The thing is that maybe, again, you think it's easy for management, but it's really hard to see what's going to work, because if you're not always testing, how are you going to know if you could do better? Make sure to have at least three ads per group.
Add emotional triggers into your ad copy
Then look at your ad copy. We see a lot of just generic like, "We are the best lawyers. Call us." There's nothing there that says I need to call these people. Really think about how you can add those emotional triggers into your copy. Talk to your client or your team, if you work in-house, and find out what are the things that people say when they call. What are the things where they say, "Wow, you really helped me with this" or, "I was feeling like this and then you came in and I just felt so much better."
That can really help to spice up your ads. We don't want to get too fancy with this, but we certainly want to make something that's going to help you stand out. Really add those emotional triggers into your ad copy.
Make sure to have a call to action
Then the next thing is making sure to have a call to action, which seems basic because you think it's an ad. If you click it, that's the call to action. But sometimes people on the Internet, they're not necessarily thinking. You just want to say, "You know what? Just call me or email me or we're open 24 hours."
Just be really specific on what you want the person to do when they look at the ad. Just spell it out for them. I know it seems silly. Just tell them. Just tell them what you want them to do. That's all you need to do.
Use extensions!
Then make sure you add in all of the extensions. In Google Ads, if you're not super familiar with the platform, there's a section called Extensions. These are things like when the address shows up under an ad, or you've got those little links that come up, or you've got somebody saying we're open 24 hours, for example. There are all sorts of different extensions that you can use. Just put in all the extensions that you possibly can for every single one of your groups.
Then they won't all trigger all at the same time, but at least they're there and it's possible that they could trigger. If they do, that's give your ad more real estate versus your competition, which is really great on mobile because ads take up a lot of space at the top of a mobile search. You want to make sure to shove your competition as far as you possibly can down that search so you own as much of that property as you possibly can. One thing that I do see people doing incorrectly with extensions, though, is setting extensions at say the campaign level, and then you have different ad groups that cover different themes.
Going back to this example over here, with the different types of lawyers, let's say you had an extension that talks specifically about DUI law, but then it was triggering on say sexual assault law. You don't want that to happen. Make sure you have really fine-tuned control over your different extensions so you're showing the right extension with the right type of keyword and the right type of ad. The other thing that we see a lot is where people have location extensions and they're showing all the location extensions where they should not be showing all the location extensions.
You've got an ad group for, say, Seattle, and it's talking about this new home development that you have, and because you just loaded in all of your location extensions, suddenly you're showing extensions for something in say San Francisco. It's just because you haven't filtered properly. Really double-check to make sure that you've got your filter set up properly for your location extensions and that you're showing the right location extension for the right ad.
I know that Google says, "We'll pick the locations closest to the client." But you don't know where that person is searching right there. They could be in San Francisco at that moment and searching for new home builds in Seattle, because maybe they're thinking about moving from San Francisco to Seattle. You don't want them to see the stuff that's there. You want them to see the stuff that's at the place where they're intending to be. Really make sure you control that.
4. Keep display and search separate
Last, but not least, keep display and search separate.
By default, Google so helpfully says, "We'll just show your ads everywhere. It's totally cool. This is what we want everyone to do." Don't do that. This is what makes Google money. It does not make you money. The reason why is because display network, which is where you're going to a website and then you see an ad, and search network, when you type in the stuff and you see an ad, are two totally different beasts.
Avoid showing text ads on the display network for greater campaign control
It's really a different type of experience. To be honest, if you take your search campaigns, which are text-based ads, and now you're showing them on websites, you're showing a boring text ad on a website that already has like 50 blinky things and click here. They're probably not seeing us and maybe they have an ad blocker installed. But if they are, certainly your text ad, which is kind of boring and not intended for that medium, is not going to be the thing that stands out.
Really you're just wasting your money because you'll end up with lower relevancy, less clicks, and then Google thinks that your group is bad. Then you'll end up paying more because Google thinks your group is bad. It really gives you that extra control by saying, "This is the search campaign. It's only on search. This is the display campaign. It's only on display." Keep the two of them totally separate. Then you have lots of control over the search ads being for search and the display ads being for display.
Don't mix those two up. Make sure to uncheck that by default. Definitely there are more tips on our blog here. But I hope that this will help you get started. SEOs, if you've never done a PPC campaign in your life, I recommend just setting one up. Put 50 bucks behind that thing. Just try it out, because I think what will really help you is understanding more of how people search, because as we get less and less keyword data from the different tools that we use to figure out what the heck are people googling when they try to search for our business, ads give you some of that data back.
That's where ads can be a really great ally in trying to get better SEO results. I hope you found this enjoyable. Thanks so much.
You'll uncover even more SEO goodness in the MozCon 2020 video bundle. At this year's special low price of $129, this is invaluable content you can access again and again throughout the year to inspire and ignite your SEO strategy:
21 full-length videos from some of the brightest minds in digital marketing
Instant downloads and streaming to your computer, tablet, or mobile device
Sign up for The Moz Top 10, a semimonthly mailer updating you on the top ten hottest pieces of SEO news, tips, and rad links uncovered by the Moz team. Think of it as your exclusive digest of stuff you don't have time to hunt down but want to read!
This week the team highlights articles focusing on recent academic papers published on the so-called social cost of carbon and their implications for energy policy, as well as how California’s energy policies stack up against their neighbors.
Travis Fisher, CEO of Electricity Consumers Resource Council, joins the show to discuss what is causing California’s rolling blackouts and what policies could be implemented to alleviate the stress on the electric grid.
According to RBC’s Head of Global Commodity Strategy, Helima Croft (subscription required), “Joe Biden’s energy agenda would likely be pragmatic, by Democratic Party standards, with no wholesale assault on the traditional fossil fuel sector.” She notes that a Biden presidency would be a sharp departure from the Trump presidency on energy policy, but the shift away from fossil fuels may not be as seismic as some in the Democratic Party wish or the public anticipates. She also noted that there is no call for banning U.S. energy exports or fracking.
Biden’s “Clean Energy Standard”
Unfortunately, Ms. Croft is in la-la land. Biden’s so-called “clean energy standard” would eliminate the 62 percent of U.S. electricity generated by fossil fuels, primarily natural gas and coal over the next 15 years, increasing electricity prices for consumers, and costing taxpayers $2 trillion—to start! Wood Mackenzie estimates the cost of full decarbonization of the U.S. power grid to be $4.5 trillion, given the current state of technology. That cost would amount to $35,000 per household or about $2,500 per year over the 14 year period that Biden would have to implement the action should he get elected and take office in 2021.
Clearly, Biden’s $2 trillion will not go very far, particularly since it is also supposed to fund energy efficiency improvements in buildings, more hybrid and electric vehicles and charging stations, an increase in public transportation including high-speed rail, and research and development in advanced nuclear power and carbon capture and sequestration systems. That figure does not include the implied costs of economic dislocation, lost jobs and industries, which might be forced to move offshore to countries with less expensive and more reliable energy—those costs would have to be discovered along the way.
Natural gas, wind, and solar are now the most common new generation fuels, but it took decades of renewable energy mandates and government spending on renewables research, tax breaks, and other subsidies to help make wind and solar technology reach this point. Even so, capacity factors for wind and solar power are half or less than what they are for coal, natural gas, and nuclear power, making the amount of generation from wind and solar capacity less than 10 percent of our generation today. For Biden to change the 62 percent of the generation currently from fossil fuels into renewable energy sources will cost far more than he states he will spend on his “clean energy” standard and other goals in the building and transportation sectors and cost American families thousands of dollars needlessly, if it even can be accomplished.
Further, both Biden and Harris have stated that they would ban fracking. Biden indicated that he would ban new hydraulic fracturing in his debate with Bernie Sanders in March 2020, although he would not admit to that declaration when campaigning in Pennsylvania this year. Also, in September 2019 during a CNN town hall event, Kamala Harris said “There is no question I am in favor of banning fracking.” Fracking accounts for about 80 percent of our abundant and low cost natural gas, used for heating, cooking, generating electricity and in numerous industrial processes.
Continuing to allow hydraulic fracturing in U.S. shale basins also requires maintaining the ability to drill, produce, and transport oil and natural gas, which would include streamlining the siting and permitting of pipelines and accelerating research and development that offers the potential to double wellfield productivity. But, Biden’s climate change plan proclaims “that every federal infrastructure investment should reduce climate pollution” and would require “any federal permitting decision to consider the effects of greenhouse gas emissions and climate change.”
Pipeline Infrastructure
The statement above is an indication that Biden would make it difficult for developers to obtain federal permits to build fossil fuel infrastructure such as pipelines, forcing them to use more expensive, less safe and more environmentally hazardous surface transportation, which has already been permitted. It also calls into questions new infrastructure investments such as airports, highways, bridges, and other transportation assets.
To slow the permitting process, Biden could require onerous and lengthy reviews to evaluate whether a project’s economic impact is outweighed by its potential emissions impact, i.e., he could make the process so burdensome and expensive for pipeline developers that they cancel the project. A spokeswoman for a group supporting Biden’s candidacy, for example, recently said this about a cancelled New Hampshire gas pipeline: “Prevent new infrastructure from being built is a win in itself.” This approach should be contrasted with China’s plan. China recently formed a $56 billion conglomerate to build and operate the country’s growing natural gas pipeline system.
As proof of Biden’s intentions, he has committed to rescinding President Trump’s permit allowing the Keystone XL oil pipeline to cross the Canadian border into the United States. This is despite the fact that moving oil by pipeline produces 42 percent fewer emissions than transporting oil by rail, which is how the oil is being transported in lieu of Keystone XL. Since 2008, the use of rail to ship oil had increased by a factor of 50, adding $5 to $10 per barrel in additional cost and greater environmental and safety risks.
Ban on New Drilling on Public Lands
Biden has pledged to stop new drilling on federal lands and waters, which would have severe consequences for the nation’s oil and natural gas industry. A federal ban on drilling would hamper oil and gas production across much of New Mexico, North Dakota and Wyoming—three of the nation’s largest oil and gas producing states, as well as offshore in the Gulf of Mexico, which produces 2.3 million barrels of oil and gas per day. For perspective, the U.S. owns 2.46 billion acres of subsurface mineral estate between its onshore and offshore public lands, which is larger than the entire landmass of the United States. All of this would be off limits to oil and gas exploration, leasing, and potential development.
A drilling ban on federal lands and waters could cost the oil and gas industry up to 1 million jobs nationally by 2022. Offshore jobs in Texas could fall to 39,000 by 2040—down from 147,000 jobs in 2019. Revenues from oil and gas royalties, which are shared with the states, also would fall as drilling permits and leases expire. Oil and gas royalties from federal property totaled $9.3 billion in 2019, including more than $1 billion from offshore drilling in the Gulf of Mexico. In vast, largely rural western states where federal lands are concentrated, the loss of those revenues means less money for roads, bridges, schools, and senior centers.
As a result, some firms are trying to secure as many federal permits as possible before November. Devon Energy, with about 20 percent of its acreage on federal land, is working to get drilling permits approved, targeting over 550 new permits by this autumn, covering 75 percent of its most prospective federal acreage. Federal permits are eligible for two-year extensions—usually a routine process under any administration—and the environmental assessments that underlie those permits are good for a period of five years.
Concho Resources, with about 20 percent of its acreage on federal land, has enough permits on its federal land in New Mexico for another 1 to 2 years of drilling. But, its planning includes the ability to shift capital to other acreage in its portfolio without significant impact to its capital efficiency.
As our blog noted, what these politicians see as “subsidies” for fossil fuels are actually commonplace business tax deductions that are mostly available to small independent oil and natural gas producers, which produce 83 percent of our domestic oil and 90 percent of our domestic natural gas. One of the tax deductions is provided to all U.S. manufacturing firms, not just oil and gas producers, while many of the others are for typical business deductions in the tax code akin to research and development costs available to all industries. These deductions have parallels for other businesses in other industries.
Conclusion
Biden’s positions on oil and natural gas have been all over the map, seemingly changing depending upon his audience. For example, in Pennsylvania—which fracking has turned into a major energy producer and which has become re-industrialized after decades of manufacturing decline—he said he would not ban fracking, despite his agreeing to do just that when he debated Bernie Sanders. And, to make matters worse, his running mate has also agreed to ban fracking. Biden-Harris could easily change back to their original proposals once elected. Clearly, if Biden gets elected, the energy industry will feel the impact and so will consumers and taxpayers. With the addition of California Senator Kamala Harris to the ticket with Joe Biden, the Democratic Party has carved its anti-oil and gas credentials into stone for 2020.
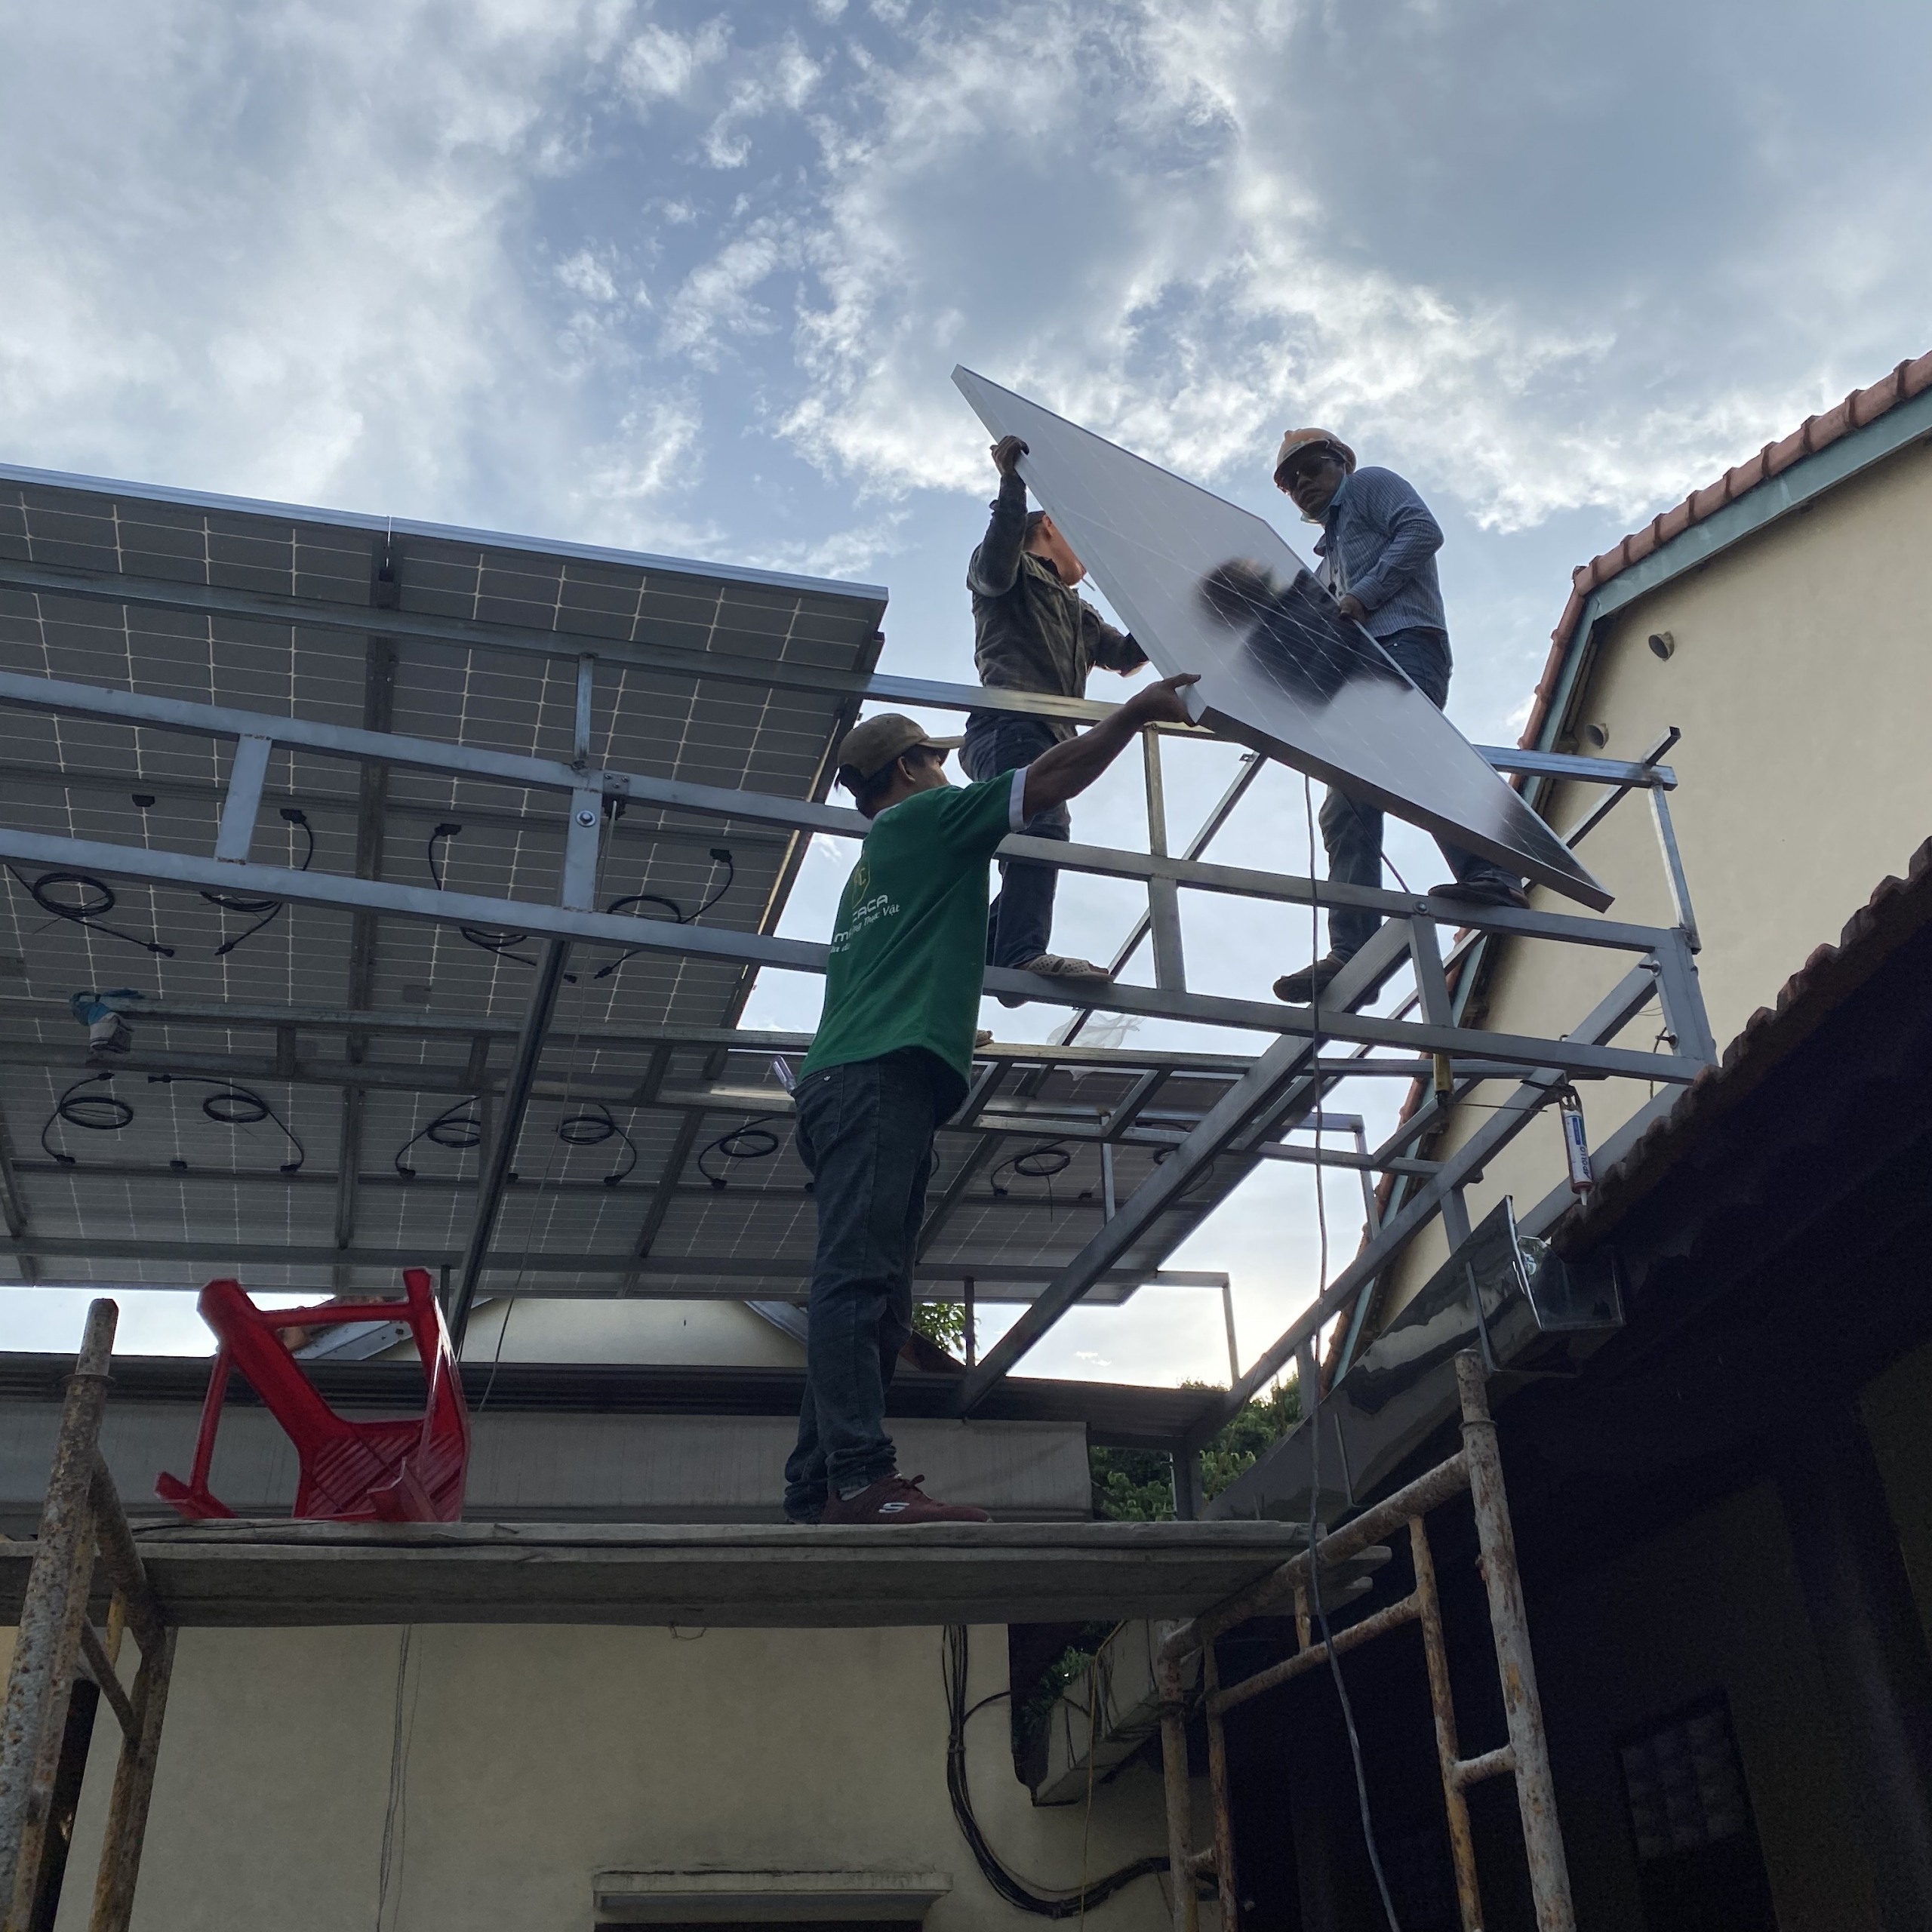
Trevor Schwartz, a current SEI student, began his travels abroad in January 2020 with the intention of eventually arriving in Nepal to participate in a GRID Alternatives volunteer solar PV installation at a health center in the Jumla district. But after traveling around Southeast Asia during the months of January and February, COVID-19 struck, forcing him to stay in Hue City, Vietnam for an extended period of time.
Easily adapting to the lifestyle, Trevor acquired multiple jobs teaching English while learning the Vietnamese language and how to ride a motorbike around the city. He also had the opportunity to experience how solar PV providers in Vietnam operate. After creating a connection with a local solar PV provider, he participated in their business processes, which included: site analysis, contract signing, system design, selling wholesale and participating in an entire solar PV installation at a cultural center. Speaking of the experience, Trevor said: “It was eye opening – I witnessed how their practices differ from standard business and installation practices in the US. Nonetheless, it was a positive experience, and the solar energy market in Vietnam seems to be growing rapidly with a lot of potential. I was fortunate to be taking online courses with SEI during this time, and was able to share some information I had learned with the employees of the solar PV company in Hue”.
SEI’s online training and work-trade program have provided Trevor with the flexibility to learn overseas and take part in solar energy projects in the developing world, all while working remotely. Trevor is not new to the NGO solar sector, having volunteered with Johnny Weiss as his Executive Assistant, helping to build the capacity for ongoing solar energy projects with the Tanzania-based NGO, Rural Community Support Organization (RUCOSUO). Trevor assisted in grant research and writing for RUCOSUO, moving projects forward and assisting in their search for funding and support for their many ongoing activities, all while creating an infrastructure to successfully secure future funding.
Having recently completed PVOL101 and PVOL203 during his time abroad, Trevor intends to continue his education at SEI and hopes to eventually work with solar NGOs like SEI or GRID Alternatives, with the goal of increasing energy access to those who need it the most. In the meantime, he is traveling around northern Vietnam on a motorbike, staying with a friend in Hanoi, but plans to eventually return to his ‘second home’ in Hue and the many connections he’s made there.
Pictured above is a 5kw solar PV installation at a cultural center in Hue, Vietnam (June 2020).
India’s wind generation fell by 43 percent in July, surprising the industry as the monsoon season has been optimal for wind generation in the past. Led by wind’s reduction, India’s total renewable energy generation this July was 24 percent less than July of last year. The primary wind power generating months are from June through September—that 120-day period provides almost 85 percent of the country’s annual wind output. In India, solar power remains productive much longer than wind power—over double the time—at least 280 days per year.
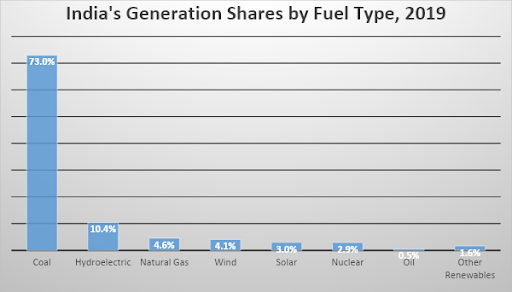
India’s 2019 Generation
By far, India uses coal to generate most of its electricity, generating 73 percent of its electricity from coal in 2019. (See graph below.) India’s non-hydroelectric renewable generation made up just 9 percent of its generation in 2019—up one percentage point from 2018. Generation from all non-hydroelectric renewables was less than that from hydroelectric power, which was 10 percent of generation in 2019. Wind generation totaled 63.3 terawatt hours and was 4 percent of India’s total generation, while solar generation was 46.3 terawatt hours or 3 percent of India’s total generation. India had 37.5 gigawatts of wind capacity and 35 gigawatts of solar capacity at the end of 2019. For the first six months of this year, capacity additions for wind have totaled 2,000 megawatts, while for solar, they have totaled 8,000 megawatts.
India’s total installed wind power capacity was the fourth largest in the world in 2019, after China, the United States, and Germany. Its wind power capacity is mainly spread across the Southern, Western, and Northern regions of the country. The data for July showed over a 50 percent drop in wind generation in most Indian states including Rajasthan, Gujarat, and Tamil Nadu. In Andhra Pradesh, wind and solar generation fell for the second year in a row.
Wind speeds have been exceptionally low this year, but it is believed that they will pick up in August and September. Wind speeds have been a worry for the first two months of the monsoon season because the wind speed pattern had changed. The number of days with good wind speed has been decreasing by about a half. However, wind generation in the initial days of August improved somewhat and wind speed is expected to pick up in the second wave of the monsoon season.
Background
Wind power saw a steady growth in India for about three decades—from 1985 to 2015. Most of its 37.5 gigawatts of installed wind capacity were built due to government incentives such as accelerated depreciation, generation-based payments and feed-in tariffs. Electricity is a huge issue in India, where the World Bank estimated in 2018 that 200 million Indians still lacked electricity. India’s economic progress is tied to the electrification of villages and the expansion of economic opportunities which comes with electricity. Therefore, having reliable electricity is very important to the nation.
In 2015, India announced a goal of installing 175 gigawatts of renewable energy by December of 2022. However, of that figure, wind was allocated just 60 gigawatts as the focus shifted to solar power. According to the Union Ministry of New and Renewable Energy, wind projects totaling 13 gigawatts are in the pipeline and another 10 gigawatts are expected to be tendered in the coming months to meet the 60-gigawatt target. However, the industry believes that wind power sector is losing its sheen and that total capacity of wind may only reach 45 gigawatts by March 2022. Its failure to perform during peak season this year may further affect plans for wind.
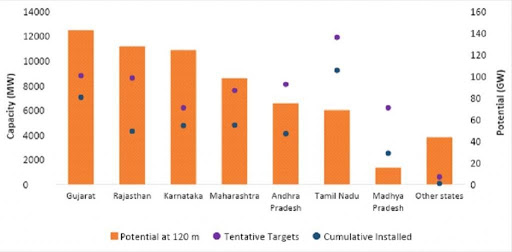
India has a high wind energy potential—302 gigawatts at 100 meters hub height and 695 gigawatts at 120 meters. Nearly 97 percent of this potential is concentrated in seven states—Gujarat, Karnataka, Maharashtra, Andhra Pradesh, Tamil Nadu, Rajasthan and Madhya Pradesh.
State-Wise Wind Energy Potential, Target and Installed Capacities
While India may have great energy potential in wind, it has allocated only a third of its renewable capacity goal for 2022 to wind. The country recently found that the technology is not achieving the wind speeds that it had in the past, particularly during the monsoon season when 85 percent of wind output is usually achieved. Clearly, wind is not as reliable as coal, which generates 73 percent of India’s electricity.
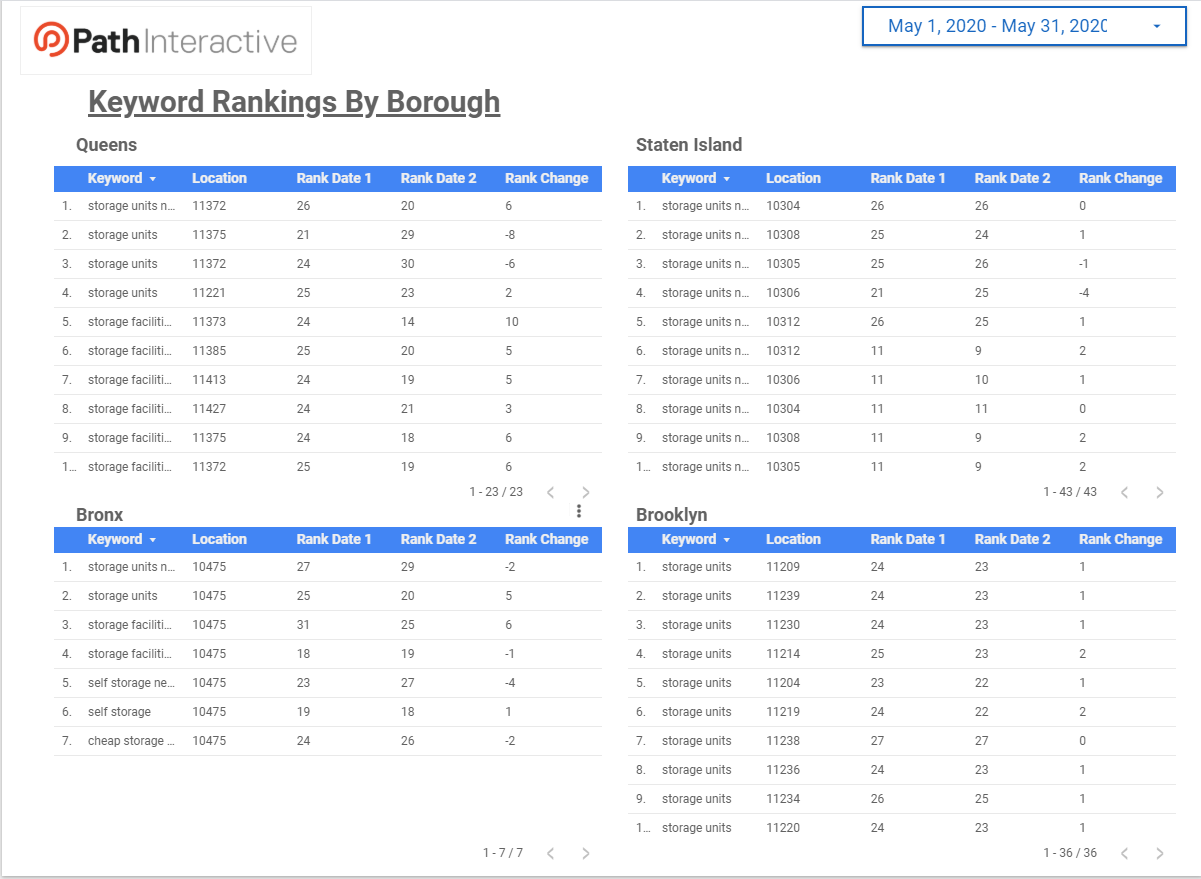
Since Moz released the new Google Data Studio Connectors for STAT, you might be wondering how to best implement them for your reporting strategy. My colleagues at Path Interactive and I absolutely love how granular you can get with your reports in STAT, and finally having the ability to cleanly and effectively pull those reports into Data Studio (the tool we use for our own reporting) is a godsend.
While the Historical Keyword Rankings connector reports on rank over time, it may not be as obvious how to report on rank change over time. In this post, I'll give you step-by-step guidance on how to report on rank change — as well as a couple other filtering and reporting tips — while using the connectors within Google Data Studio.
If you aren't a STAT user yet but you want to know how it might fit into your SEO toolkit, you can take a tour of the product. Click on the button below to set one up!
Before you begin, you need to identify a few things to set up the connector: your STAT Keyword API Key, the Project ID, and your Site ID. If you don’t already know how to identify these via the STAT API, you can head over to STAT’s documentation here to learn more. After you’ve identified these, it’s time to connect your data source.
We’re going to be doing something a little out of the ordinary here, but stay with me — you’ll see why in just a second!
For this step, we'll be connecting two instances of the same source. Because our goal is to compare rank change over time, we’ll use the same source twice to identify those deltas.
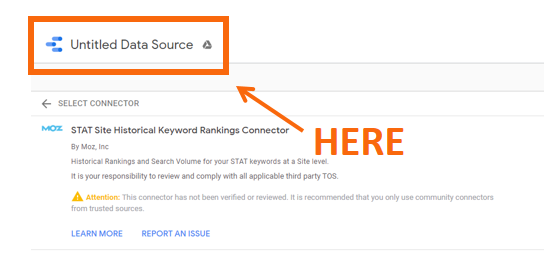
When setting up your connector, be sure to name the source something that you’ll easily recognize:
In my case, I usually go with something simple such as “[client name] STAT Keyword Connector.” When this is complete, repeat the step above, but name it something different, e.g. “[client name] STAT Keyword Connector 2.”
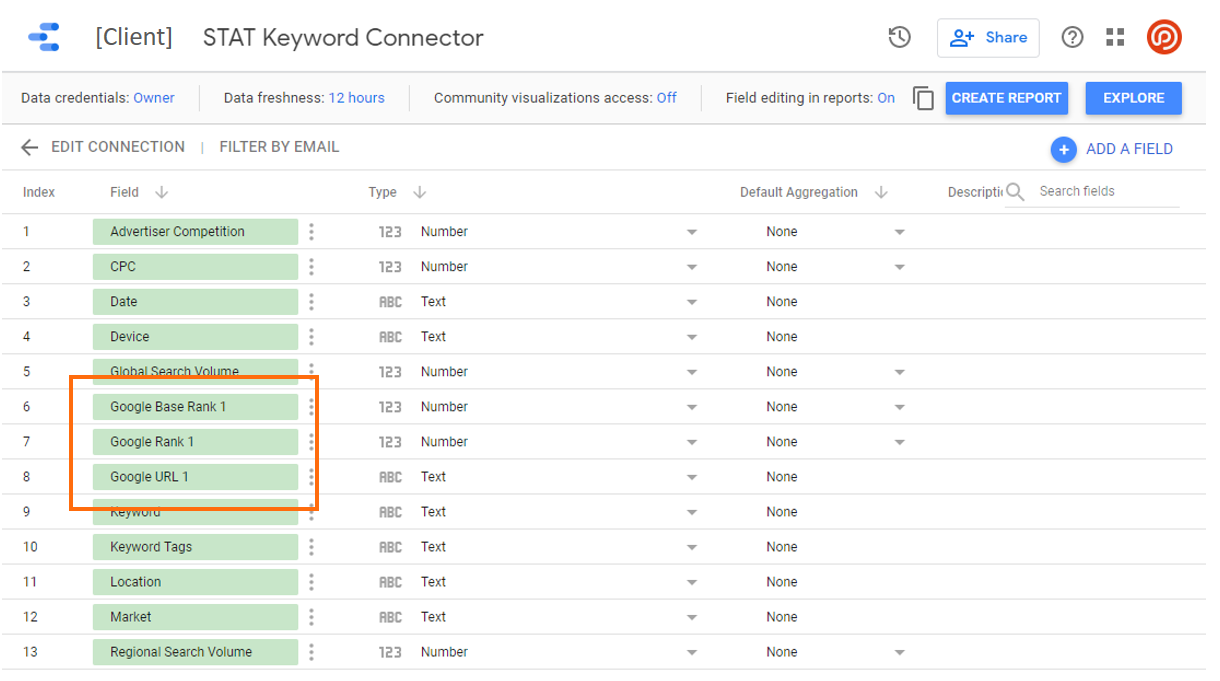
Finally, make sure the metrics you plan on comparing have unique names for each connector. To do so, go into your data source. Click on the metric’s name so that you can rename it, and then rename it something unique. For this case we'll be doing it for “Google Base Rank,” since we're comparing ranks, but it can also be done for “Google Rank,” if we wanted to compare that. Again, I like to just keep it simple: for the first data source call it “Google Base Rank 1,” and then for the second data source call it “Google Base Rank 2.” When all is said and done, it should look something like this:
Building your table and blending data
Now we’ll start to get a bit more technical. Blending the data of the two connectors lets you compare two instances of rankings against each other. Your final result will produce a table showing the ranks of two given dates, as well as their rank change. The five-step process will look like this:
Blend data of keyword connectors one and two
Add in your common metrics for the two sources (keyword at the minimum, but you can also add in location, device, market, and search volume)
Add in the metric you'd like reported (Google base rank and/or Google rank)
Set date range
Apply “No Null” filter
1. Blend data of keyword connectors one and two
The first step here is to blend the two connectors so that you can compare two instances of ranks against each other.
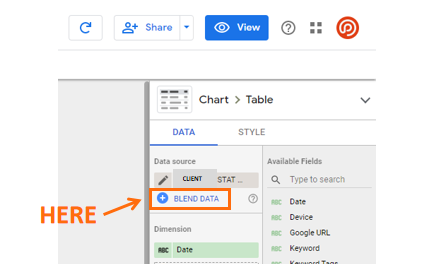
First, you need to create a new report, or go into a report that's already set up. Next, select your data source. Here you'll select the first instance of the source that you set up earlier (if you’re starting on a fresh report, it'll ask you to add a data source immediately). Once selected, click on “Blend Data” underneath the data source on the right hand side of Google Data Studio, seen here:
This will bring you to the Blend Data source tool. From here you select to add another data source, being your second instance of the connector.
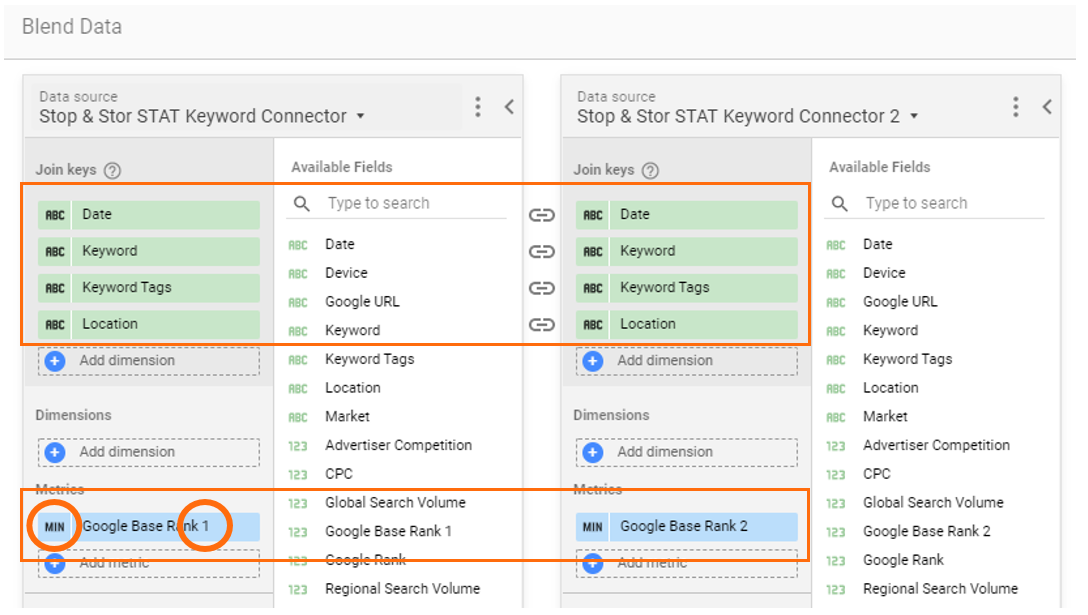
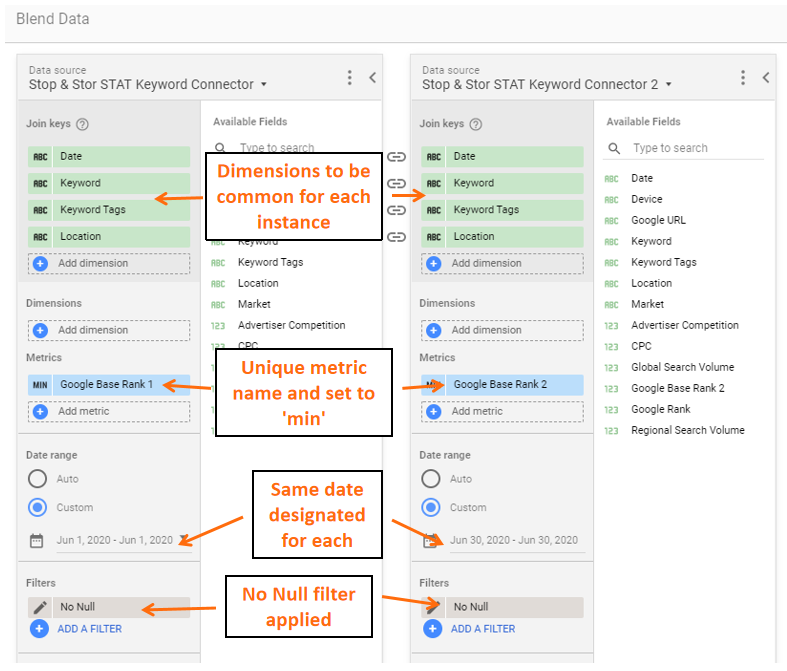
2. Add in your common metrics
Once you've chosen to blend both connectors, you need to set your metrics. Towards the top, you’ll see “Join keys.” This is in reference to what's going to be the same for both instances, so here at the minimum, you want to include “keyword.” Feel free to play around here with adding different metrics.
Note: We'll go over this later, but if you plan on having different graphs filtered by a certain tag or location, make sure to add these in here.
3. Add in the type of rank you want reported
After setting your metrics under “Join keys,” now select the metrics that will be unique for each date. Depending on what you want to compare, under “Metrics” you'll pick “Google Base Rank,” “Google Rank,” or both. You may also include “Date” here too if you'd like. Once done, click on “SUM” next to the metric name, and change this to “MIN.” You'll see why in just a moment.
At this point, your blended data should look something like this:
4. Set date range
Now you need to set the two date ranges you're comparing to each other.
To do this, under the first connection, set your first date: Under “Date Range,” click on “Custom,” then click on the field to select your date. Here you might see that there's an option for two dates, but for this solution, we're using the same date for each connector.
In the end, it'll be something like “Connector 1” selected for the “start date” and “end date” as the first of the month, and for “Connector 2,” the “start date” and “end date” will be the last of the month. This is essentially pulling in the rank for the first instance as well as the second instance, so you can compare the two.
5. Set “No Null” filter
The last step in setting up your blended data is creating a “No Null” filter. When the keyword connector reports on ranks that your site is not ranking for, it will return as "null." To avoid flooding your data with fluff, you need to create a filter removing instances of "null."
First, click on “Add A Filter” below where you selected the date range. Next, towards the bottom, click on “Create A Filter.” Set the parameters of the filter as “Exclude” > “Google Base Rank 1 (2)” > “Is Null.” Be sure to name the filter something identifiable such as “No Null.” It should look like this:
Applying rank change to your report
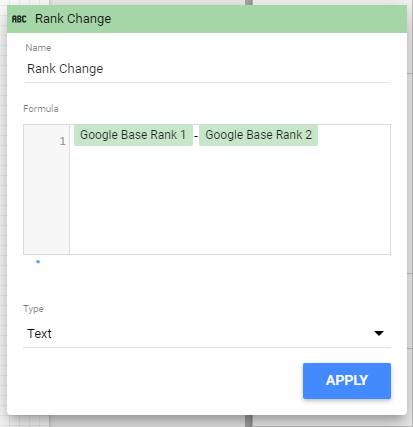
Now you can create a new field that will report on the rank change by making a calculated field to find the difference of the two ranks.
Under dimensions, select “Add Dimension,” and click on “Create Field.” You can name it “Rank Change,” but to create the field, start typing “Google Base Rank,” and you’ll see your instances from each connector come up. To make the calculated field, select your “Google Base Rank 1” and subtract it from “Google Base Rank 2,” so it should look something like this:
Hit apply, and now your rank change should be calculated!
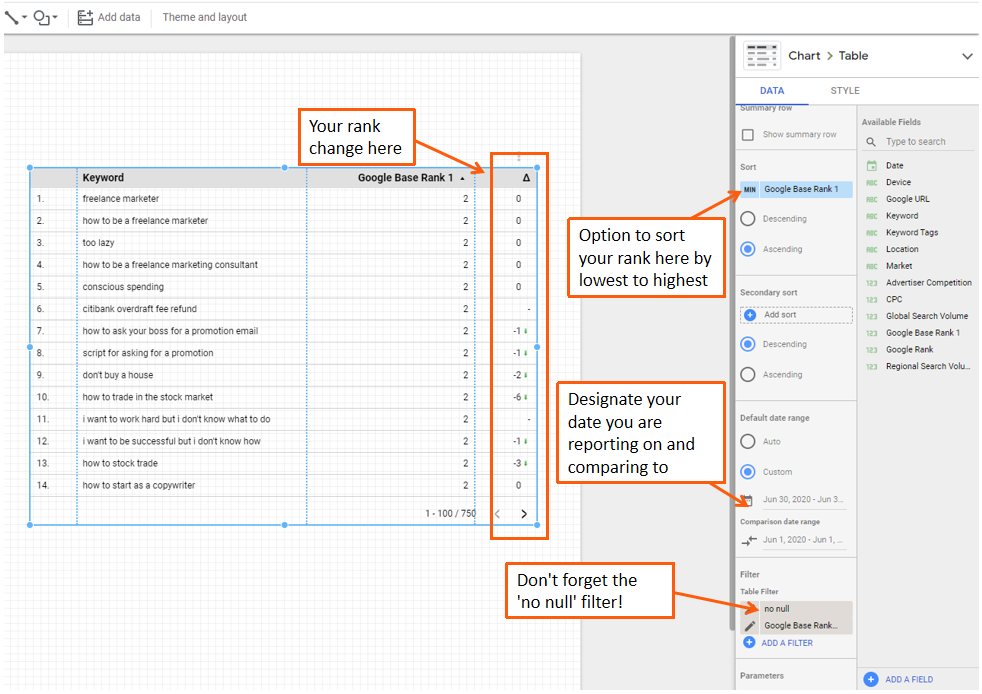
There is also an additional way to get the same result, but with a few drawbacks, such as not being able to name the header, as well as not being able to filter or sort your rank change. The benefit to this approach is that it's easier to set up initially, as you don’t actually need to blend the data. However, not setting up the blended data will also forfeit having the initial rank visible. When in your edit view, set a custom date range that you're reporting on under “Default date range.” Here, you can then set a comparison date: if looking back a month, you can set this to the first. If you go with this option, it should look like this:
Head into the "Style" tab, where you can change the comparison to “Show Absolute Change” under “Metrics.” You can also change the colors of your positive and negative arrows to more accurately represent the movement (you can see from above that the “negative” change is a green arrow, this defaults to red).
Using filters
Applying filters to your data set can be extremely beneficial to making sense of your data! Using filters with the connector can help you segment out rankings for a particular location, or create charts that show rankings for a specific keyword group that you’ve set up using keyword tags.
Take a look at this report I set up as an example. Within STAT, I created keyword tags to target locations determined by what zip code they were. Then, I was able to create a filter for each chart targeting that keyword tag:
Setting filters up is extremely simple. First, go into edit mode. Next, scroll down the side until you find “Filter.” Then under Filter > Table Filter, click on “Add a Filter.” This will bring you to the filter picker. Toward the bottom, click on “Create a Filter.” Here you can set the parameters for the filter you'd like to show.
Some of my other favorites include filtering to only show the top few pages (filters out non-relevant and high ranks), using the keyword tag filter like I showed before, and also filtering by location. But you don’t have to stop there! Adding in the additional dimensions available to you in the connector, you can use the filter to show things such as desktop vs. mobile or how your keyword ranking performance does in different markets.
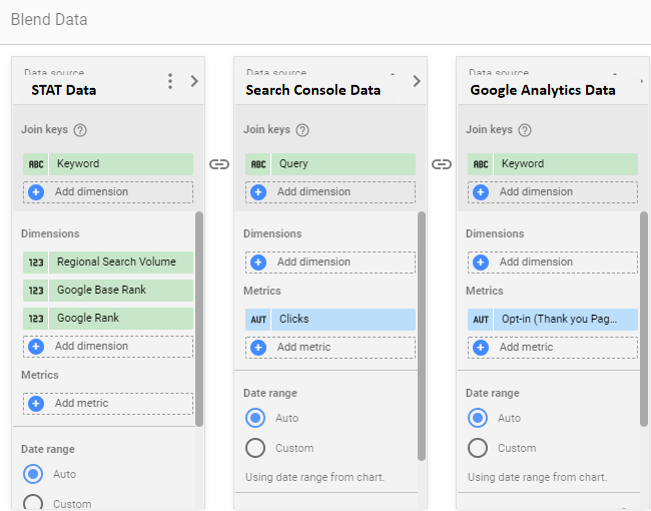
Blending your Google Analytics, Google Search Console, and STAT data
One of my favorite uses for the connectors is the ability to blend the data with your Google Analytics and Google Search Console data. By blending this data together, you’re able to directly tie keyword rankings with different metrics, such as clicks or goal completions.
You’re probably a pro at blended data at this point, but just for reference, the data blended should look like this:
A few things to note: it’s important what order you put the connectors in. I’ve found that adding the STAT connector first works best (i.e. if you put Google Analytics first, you’ll get a report with the infamous "not found" keyword). Additionally, to pull in Search Console data in order to match with your other connectors, using “Query” will have the same effect as “Keyword.”
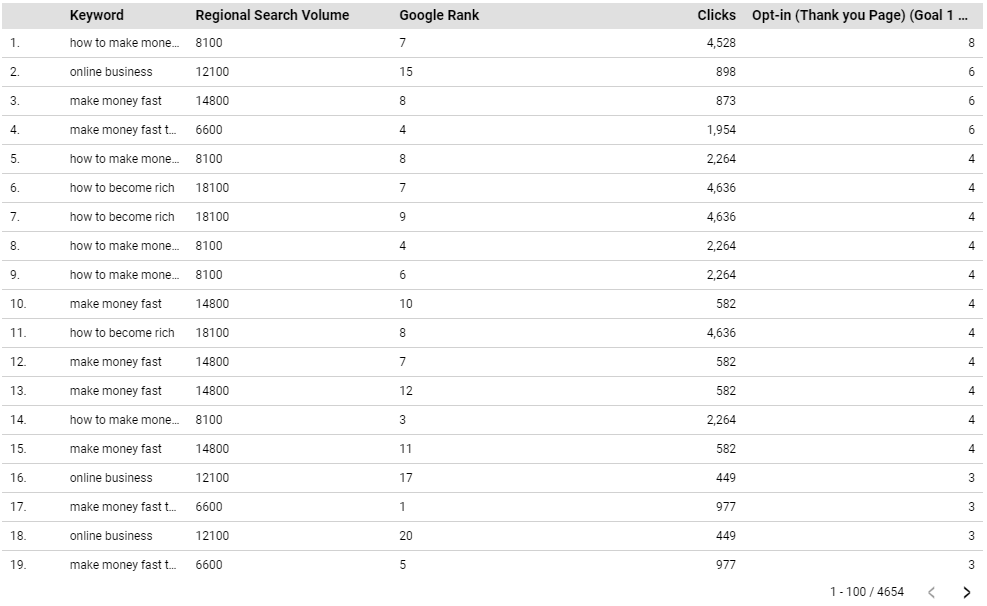
The result would look something like this, but feel free to edit the design how you wish!
Now you can go even further with this and match up URLs, but this will require some RegEx.
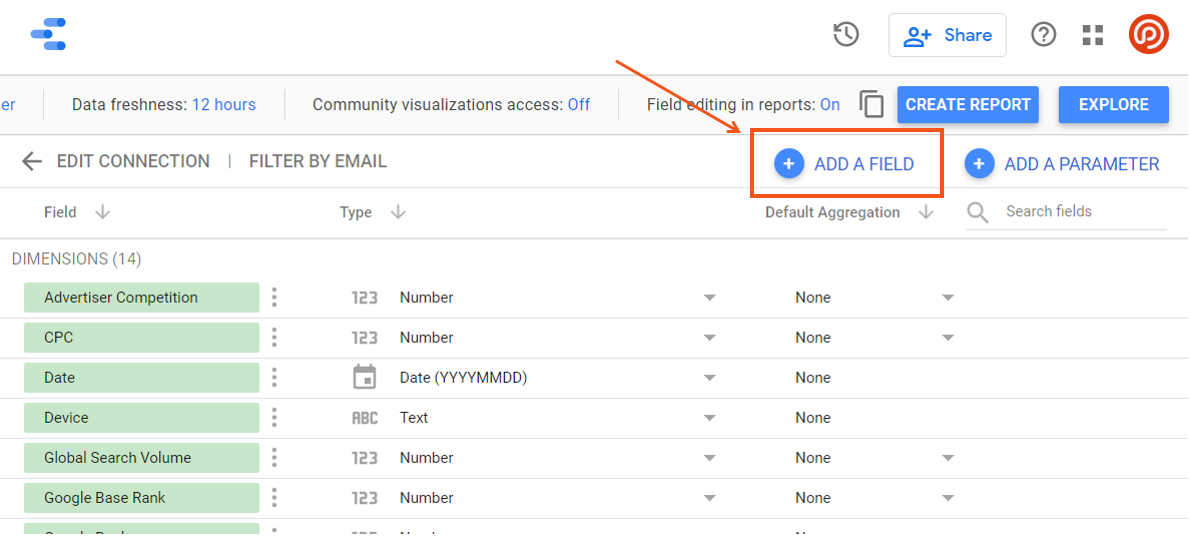
You'll rename the “Google URL” field in STAT and “Landing Page” field in Google Search Console in order to match the URL structure convection within Google Analytics by taking out the domain portion of the URL. To do this, go into your data source for each STAT connector and Google Search Console, and click “Add A Field” in the top right.
Next, enter to following RegEx for the STAT connector:
REGEXP_REPLACE(Google URL, ".*[\\.]com", "")
And for Google Search console:
REGEXP_REPLACE(Landing Page, ".*[\\.]com", "")
Remember to name them something to differentiate from the default field. I use “Landing Page (no domain).”
When building a report, use these new fields for consistency across the URL structure so that, when you select them when blending data, they'll match.
Use this method in the same way as above to get the desired results of pulling in data from across all three connectors to match up with each other! In the end you should be able to find what keyword ranks for what URL, as well as have many sessions or clicks that are brought in as well as goal completions, or any other combination.
Well there you have it! Hope this was helpful to you. If you have any other questions you can comment below or find me on Twitter @ianpfister. Happy reporting!
To help us serve you better, please consider taking the 2020 Moz Blog Reader Survey, which asks about who you are, what challenges you face, and what you'd like to see more of on the Moz Blog.
Sign up for The Moz Top 10, a semimonthly mailer updating you on the top ten hottest pieces of SEO news, tips, and rad links uncovered by the Moz team. Think of it as your exclusive digest of stuff you don't have time to hunt down but want to read!
California prides itself on being at the forefront of the so-called energy transition, having set its first renewable portfolio standard in 2002, requiring 20 percent of its electricity to come from renewables by 2010. In 2008, California increased the state’s renewable portfolio standard to 33 percent by 2020, followed by SB 350, which in 2015 increased the standard to 50 percent by 2030. Then, in 2018, SB 100 accelerated the state’s renewable portfolio standard to 60 percent by 2030, and required that the next 40 percent of generation come from zero-carbon sources (e.g., wind, solar, geothermal, and hydropower) of electricity by 2045. California has retired most of its nuclear plants with only the Diablo Canyon nuclear plant left, which is scheduled to retire by 2025. The Diablo Canyon nuclear plant currently provides 8 percent of California’s electricity—all of it carbon dioxide emission-free. California has clearly shown it does not welcome nuclear, which currently cannot compete economically with natural gas, wind, or solar.
California’s reckless march into renewable energy has proven feckless. Its policies caused rolling black-outs in the August 2020 heat wave because when solar energy production dies down in the evening and when residents turn up their air conditioning and other appliances as they arrive home, there has recently been insufficient capacity to meet demand. California has been prematurely retiring reliable natural gas and nuclear plants in favor of renewable energy, particularly solar power, causing load capability to be diminished when the sun sets. In fact, the state has built so much solar that at times during midday, some of the solar power cannot be used and grid operators have to pay people to take it. Normally, when the state has insufficient power toward evening, it buys extra power from neighboring states, where it gets 15 percent of its power, but because of the regional nature of the heat wave, those states did not have excess power to bail out California from its self-imposed electricity problems.
California Alternatives
Over the August 15 to 16 weekend, the California Independent System Operator imported hydropower from the Pacific Northwest, and the U.S. Bureau of Reclamation released emergency water flows from the Glen Canyon Dam on the Colorado River to generate hydroelectricity. Reservoirs were relatively full after a somewhat wet winter. Los Angeles’s Department of Water and Power also supplied power, obtaining almost 20 percent of its electricity from out-of-state coal.
Governor Newsom waived the state’s emissions standards to allow businesses and utilities to run on-site fossil-fuel generators, many procured for emergency power outages during wildfire seasons, which also helped to deflect rolling blackouts. This meant Californians had to live with more localized pollution because of a breakdown in the system sold to residents as the answer to global climate change. To ward off similar events in the future, the Public Utilities Commission directed utilities to triple their battery storage for electricity by 2026, which is expensive, but also insufficient to replace the natural gas and nuclear retirements expected in the interim.
Analysis indicates that California has shut down about 5,000 megawatts of natural gas-fired power plants without adequate replacements. Even though state officials extended operations in the past year of some natural gas units to keep them on hand for emergencies, grid operators admitted that it was insufficient for the recent heat wave. Despite some studies showing high levels of renewables are feasible, particularly with more storage, experts indicate that the changes needed in grid operations will be enormous—essentially a complete redesign of the power sector—if one is pursuing a 100 percent “clean energy” standard as Mr. Biden is doing. Even the National Renewable Energy Laboratory concluded in a recent study that “integrating high shares of wind power is technically achievable but will require changes to operating practices.”
A prudent policy would be to “push the pause button” before more reliability and cost issues result for California’s suffering consumers. Yet, at a national level, Democratic Party presidential candidate Joe Biden has touted a similar system for the entire United States. Given California’s recent experience, such a policy looks less and less like a “Green New Deal,” and more and more like a “Great Leap Backward.”