Former Vice President Joe Biden promised to stop issuing leases for oil and natural gas drilling on federal lands and in offshore areas and he promised to ban hydraulic fracturing, known as “fracking”. The logical result of these positions would be for the newly energy-independent United States to go back to importing much more of its oil from the Middle East for it is clear that it will be many decades before electric vehicles could replace gasoline engines and that substitutes could be found to replace products made from oil. It is fracking that has made the United States energy-independent and natural gas produced by fracking that has reduced our carbon dioxide emissions—one of only a few countries to do so. Further, by banning oil production on public lands and offshore areas and by banning fracking, the United States will be giving money to foreign oil producers rather than employing the hundreds of thousands of Americans currently working to produce our oil.
Former Vice President and presumed Democratic Party presidential nominee Biden wants us to believe that he will continue with the policies of the Obama Administration, many of which he argues were his accomplishments. But, the Obama Administration supported fracking while unsuccessfully pursuing tighter regulation of the technology because the Administration could not prove that fracking caused contamination of drinking water, air pollution, methane leaks, and/or earthquakes. Hydraulic fracturing is a drilling and extraction method of releasing oil and natural gas from underground shale rocks, using high pressure liquid to break them apart. The technology, when combined with horizontal drilling to access the horizontal deposits of organic material, has made the United States the top oil and natural gas producer in the world and lowered U.S. carbon dioxide emissions. In fact, the U.S. led the world in reducing carbon dioxide emissions in 2019, and since 2000, has reduced absolute emissions more than any other country.
U.S. Oil Production and Imports
Fifteen years ago, the United States was importing most of its oil — 12.5 million barrels per day on a net basis (imports minus exports), or almost twice our domestic oil production. Also 15 years ago, the United States was emitting about 14 percent more in greenhouse gases than it does today. Official agency projections of the world’s need for oil and natural gas made by the U.S. Energy Information Administration and the International Energy Agency indicate that natural gas and oil should continue to supply half or more of global energy demand for decades to come. These fundamentals reflect the need for energy to support human and economic development—as well as the sheer enormity of global energy systems, infrastructure and transportation fleets on the road, in the air and on the sea.
The United States has an abundance of natural gas and oil resources and production, thanks largely to technological innovations like hydraulic fracturing, horizontal drilling, 3D imaging, and advanced data analytics. These innovations have made domestic natural gas and oil competitive. In January, the United States produced almost 13.0 million barrels per day of crude oil and another 5.0 million barrels per day of natural gas liquids and exported over 8.7 million barrels per day of petroleum. During that same month, the United States produced 95.4 billion cubic feet per day of natural gas.
In a competitive market, economic fundamentals suggest that a negative demand shock would likely result in lower prices, which is a result of the lowered oil demand from the coronavirus. As producers adjust to the lower demand, their drilling activity and supply may be reduced in response. However, the United States achieved production records for crude oil, natural gas and natural gas liquids due to productivity gains and new pipeline infrastructure, which are a testament to the innovation and strength of the U.S. energy revolution.
Former Vice President Biden must want us to believe that renewables can replace fossil fuels in the generation sector. But, renewable energy cannot replace the contribution currently made by natural gas because wind and solar are intermittent technologies that do not perform when the wind is not blowing and the sun is not shining. For example, recent analysis showed that Minnesota’s solar production was limited to only 5.6 percent of capacity in December, 2018. Further, renewables will not be powering most people’s cars for many decades due to the difficulty and expense involved in battery design and production. Thus, cars will continue to run on oil and Biden’s ban on domestic oil production will just result in more expensive gasoline at the pump made from imported oil.
Conclusion
Former Vice President and presumed Democratic Party presidential nominee Biden supports policies that would make the United States more dependent on foreign oil again by banning oil production on federal lands and in offshore areas as well as banning fracking—the technology that has made the United States the top producer of oil and natural gas in the world. Not only would this put money in the hands of foreign producers and reduce employment in the United States, it would be a national security issue by making the United States dependent on the Persian Gulf for oil.
New York State has a healthy energy mix, relying in large part on highly reliable sources: nuclear, natural gas, and hydro. Unfortunately, the state’s leaders consistently work to undermine this reliability. They block pipeline projects that would improve the availability of natural gas for commercial, residential, and power purposes, and there is constant opposition to the continued operation of the state’s six nuclear reactors. This problem is most evident in regards to the two reactors at Indian Point.
On April 30th, Unit 2 at the Indian Point Energy Center in Buchanan, New York, 24 miles outside of New York City, is set to close. Unit 3 will follow it a year later on April 30th, 2021 (Unit 1 shut down in 1974). Losing Unit 2’s reliable electricity will be a major drain on New York’s grid, and will either raise emissions, energy prices, or more likely than not, both.
Reliable baseload power is essential, especially for a state that is looking to increase its share of wind and solar, which are notoriously intermittent generation sources. The state also has serious natural gas supply issues due to pipeline projects being blocked and delayed, as well as due to its ban on hydraulic fracturing.
Both Indian Point reactors are currently operating on renewed licenses from the nuclear regulatory commission, and received their initial operating licenses in 1973 and 1975 respectively. The renewed license for Unit 2 was originally good until 2033 and Unit 3’s until 2035, but an agreement between Entergy, the company that owns Indian Point, and the New York state government resulted in their license terms being shortened to 2024 and 2025 respectively.
The decision by Entergy to shut the plant down was reached because of a combination of low energy prices, and expensive litigation with the state of New York.
New York Governor Andrew Cuomo, who has been a longtime critic of Indian Point, reached the agreement with Entergy has a long record of opposition to the plant, which he views as unsafe given its proximity to New York City. In his 2017 State of the State address, as he discussed the planned shutdown, he said, “I am proud to have secured this agreement with Entergy to responsibly close the facility 14 years ahead of schedule to protect the safety of all New Yorkers.” He has long viewed the plant as a safety hazard, but this is at odds with expert industry analysis.
The Nuclear Regulatory Commission continues to attest to the facility’s safety; it scored Green on all performance indicators in the fourth quarter of 2019, and remains in the Licensee Response column on the agency’s Action Matrix, the best possible position.
Cuomo’s view of Indian Point has more to do with his preference for a different energy future than it does with any real danger presented by the plant’s continued operations.
Indian Point provides 12 percent of New York State’s electric power. Because of this, it’s important to consider how that capacity will be provided once the plant is shuttered.
The main alternatives to Indian Point’s power in New York are either increased use of natural gas for electricity, expanded use of wind and solar technologies, or some combination of the two.
According to the Energy Information Administration’s annual short-term energy outlook, the lion’s share of the generation shift will likely be accounted for by increased use of natural gas. A projected increase of 11.5 billion kilowatt-hours from 2019 to 2020, with another additional 4 billion KwH from 2020 to 2021. They also account for an increase in the use of non-hydro renewables. An increase of .6 billion KwH from 2019 to 2020, and an additional 2.7 billion KwH from 2020 to 2021.
New York has major pipeline and supply issues which of late have been most publicly notable in the moratorium by provider National Grid on residential gas hookups because of short supply that ended in November when Gov. Cuomo threatened to revoke their license to operate unless they started accepting new customers. But although the moratorium is gone, the pipeline problems that preceded it continue. Wind and solar present their own issues in terms of land use and reliability. Getting rid of Indian Point is bad policy in terms of emissions, energy availability, levelized cost of electricity, or land use.
In his 2017 when the plan to close Indian Point was first announced, the Governor’s office claimed that, “Replacement power will be in place that adds no new carbon emissions and will have a negligible cost impact to ratepayers.” It is hard to see how this is possible when this will be replaced in large part by increased natural gas use, which although fairly low-emitting, will still be an increase from the non-carbon emitting nuclear capacity it’s replacing.
Replacing Indian Point by building wind and solar capacity poses possible land-use problems. As Robert Bryce pointed out in Forbes, “Replacing the 16 terawatt-hours of carbon-free electricity that is now being produced by the twin-reactor plant with wind turbines will require 1,300 times as much territory as what is now covered by Indian Point.” Wind and solar projects in the state often face significant pushback from their neighbors, and the space necessary to replace capacity lost by the closure of Indian Point could be a hard sell.
It also doesn’t make sense from the perspective of levelized costs of electricity.
Why prematurely get rid of built energy infrastructure for which the largest cost is upfront construction? According to the Institute for Energy Research’s 2019 study, “The Levelized Costs of Electricity From Existing Generating Resources”, already existing nuclear infrastructure provides the lowest cost per megawatt-hour of any generating source.
Closing nuclear plants like Indian Point, that have decades left in a safe operating life is a short-sighted policy. The costs of building new generation are far higher than those of diligently maintaining the existing energy infrastructure. New York will likely come to regret its fear-fueled abandonment of this reliable nuclear capacity.
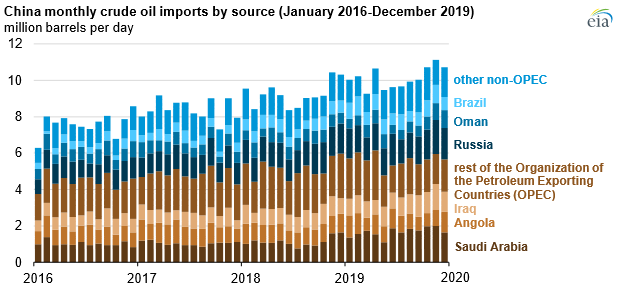
With the twin blows of the Saudi-Russian oil production increases and the worldwide coronavirus pandemic causing a historic drop in oil demand, energy producers are facing the lowest prices on record, and the People’s Republic of China (PRC) is buying as much oil as possible at rock-bottom prices. While China’s numbers are not readily transparent because they consider energy to be critical to their national security, we attempt to give a picture based upon numbers that have appeared in public places. It is clear that China is using the opportunity to purchase low-cost oil stemming from the coronavirus.
In September, prior to when the reports of the coronavirus began in Wuhan, the head of development and planning at China’s National Energy Administration said the country had total oil reserves, including strategic stockpiles, for about 80 days. While the exact amount of stored crude oil was not disclosed, it was expected to be around 788 million barrels, based on China’s average daily imports of 9.85 million barrels per day for the first eight months of 2019.
In September, the head of development and planning at China’s National Energy Administration also said the country will complete building the second phase of its strategic oil storage in 2020. In December, state-owned China National Petroleum Corp. indicated that the government intends to boost the capacity of its strategic petroleum reserves to 503 million barrels by the end of this year, an indicator of the maximum amount the government can store.Lo
China’s filling up of its strategic reserves and stockpiles could help somewhat with the demand destruction from country lockdowns due to the coronavirus pandemic and the price war between Saudi Arabia and Russia.
China’s Oil Imports
China’s crude oil imports have remained robust, increasing by 4.5 percent in March from a year earlier, despite refiners’ output of oil products falling 6.6 percent. Since Chinese refiners were probably producing more petroleum products than the economy needed, they, like refiners in other countries, have plenty of both crude and finished petroleum products such as gasoline. Emerging from the coronavirus lockdown, China’s oil refiners are buying ultra-cheap spot cargoes from Alaska, Canada, and Brazil, taking advantage of the deep discounts at which many crude grades are being offered to China due to non-existent demand elsewhere. The discounts of these spot cargoes vary between $5 and $9 a barrel to Brent, so Chinese buyers are able to stock up on crude oil priced at $15 a barrel or less.
To complicate market matters, this month, Saudi Arabia offered deep discounts to its customers in Asia—its largest market. In 2019, China’s crude oil imports from Saudi Arabia were 1.7 million barrels per day, or 16 percent of total crude oil imports. Russia was the largest non-OPEC source of China’s oil imports in 2019, averaging 1.6 million barrels per day—15 percent of its total imports. Brazil overtook Oman as the second biggest non-OPEC source of China’s oil imports, averaging 0.8 million barrels per day for the year. The United States oil imports to China dropped in 2019 due to trade war tensions that had China imposing tariffs on U.S. goods, including crude oil and liquefied natural gas. In 2019, U.S. oil exports to China averaged 133,000 barrels per day.
Several factors contributed to China’s increase in crude oil imports. China’s petroleum demand outpaced its domestic oil production. China’s domestic crude oil production averaged 4.9 million barrels per day in 2019—essentially flat since 2012, averaging between 4.8 and 5.2 million barrels per day annually. China’s consumption of petroleum products in 2019 increased by 0.5 million barrels per day to 14.5 million barrels per day, resulting in China’s net imports of crude oil increasing to 9.6 million barrels per day.
Also affecting China’s crude oil imports in 2019 was the strategic stockpiling of crude oil and increases in commercial crude oil inventories following refinery expansions, which require increases in storage as refineries begin operations. Last year, China’s refinery capacity increased by 1.0 million barrels per day, with two new refining and petrochemical complexes coming online—each with capacities of 0.4 million barrels per day. As a result, the country’s refinery processing also increased to an all-time high in 2019, averaging 13.0 million barrels per day.
EIA estimates China’s domestic petroleum and other liquids consumption averaged 13.9 million barrels per day in the first quarter of 2020, a decline of 0.6 million barrels per day from the 2019 annual average as a result of the Chinese government’s containment measures related to the outbreak of the 2019 coronavirus outbreak. Despite lower demand, China increased its oil imports from Saud Arabia and Russia. For the first two months of 2020, China’s crude oil imports from Saudi Arabia increased 26 percent, while oil purchases from Russia increased by 11 percent. The United States did not export any crude oil to China in January and February this year. However, U.S. oil exports to China are likely to pick up later this year as China starts to grant tariff waivers on certain U.S. products including crude oil.
Conclusion
China, the world’s largest oil importer, is seizing the opportunity of ultra-low oil prices to fill up its strategic petroleum reserve and commercial stockpiles. Whether it will help the demand destruction from the coronavirus pandemic and the Saudi/Russia price war is unclear. But, buying extra barrels of crude oil is at least some help for producers. The United States is opening its strategic petroleum reserve to companies that would like to lease storage space, which may also help energy producers.
The PRC views energy as vital to its national and economic security and is taking the opportunity provided by the coronavirus pandemic to strengthen its energy position.
Worldwide automobile sales have fallen by large numbers and countries and automakers are incentivizing purchases. In China, auto sales fell 43 percent in March—after the even larger plunge of 79 percent (1.43 million vehicles) in February. But the sales slump in China started before the outbreak of the coronavirus when the country changed their vehicle subsidization and emissions policies. Light-duty vehicle deliveries in China have now declined for 21 consecutive months. In Western Europe, sales of sedans and SUVs fell more than 50 percent, outpacing the U.S. fall of almost 40 percent, and lower numbers for both are expected for April. In Western Europe, auto sales may be down by as much as 80 percent in April, while U.S. April sales are expected to fall by less—60 percent.
Western Europe
Western Europe’s auto sales declined by 52.9 percent in March to 774,280 vehicles compared with the same month last year, bringing the annual expected selling rate down to 6.6 million—an annual adjustment of 22 percent. In Italy, March auto sales were down by 85 percent, in France by 72 percent, in Britain by 44 percent and in Germany by 38 percent.
United States
Automakers are facing a large decline in sales in the United States—the world’s second-largest car market—after states instituted “stay-at-home” orders forcing dealerships to close. Fiat Chrysler Automobiles NV, for example, extended its shutdown of U.S. and Canadian plants until May 4.
As a result, in March, U.S. sales fell 38.6 percent to 983,174 vehicles, which was slightly less than the 41.4 percent decline in February 2009 after the financial crisis. U.S. auto sales for April and May are set to be worse, bringing full year light-duty vehicle sales down to 14.2 million units—14 percent less than the annual expected sales of 16.5 million. According to General Motors, its first-quarter sales fell 7 percent because of significant declines in March.
With auto showrooms shut during the coronavirus pandemic, Fiat Chrysler and General Motors are trying to reinvigorate sales with seven-year, no-interest loans and by allowing customers to buy vehicles online. Fiat Chrysler’s “Drive Forward” marketing program includes online shopping tools that allow U.S. customers to complete the purchase of a vehicle through a dealer without visiting a dealership. General Motors’ “Shop.Click.Drive.” program also allows customers to find, purchase, and arrange for home delivery of a vehicle.
The online sales and home delivery program is contrary to a U.S. auto sector tradition of manufacturers giving franchised dealers control of sales to consumers. U.S. dealers, for example, fought Tesla’s efforts to sell vehicles directly to consumers via its website.
GM and Fiat Chrysler’s promotions of extended loans are not new. They are similar to the “Keep America Rolling” sales program GM instituted after the terrorist attacks of September 11, 2001.
China
China, the world’s second-biggest economy and the world’s largest auto market, locked down parts of the country to contain the spread of the coronavirus. The travel restrictions contributed to a 19 percent drop in auto sales in January, a 79 percent drop in February, and a 43 percent drop in March.
Showroom traffic at car dealerships in China are slowly returning to normal levels, having remained closed until February 8. With almost 99 percent of franchised dealerships reopened, average showroom traffic is at 66.4 percent of normal levels, according to the latest survey by the China Automobile Dealers Association. The average revenue generated by new-vehicle sales was 63.8 percent of normal levels, according to a survey of 8,721 franchised stores across China.
General Motors’ vehicle sales in China fell 43 percent in the first three months of 2020 compared with the same period last year as the coronavirus pandemic reduced the demand for vehicles. GM, China’s second-biggest foreign automaker, delivered 461,716 vehicles in the first quarter. The first-quarter drop follows a second straight decline in annual sales in 2019.
GM has a joint venture in China with SAIC Motor Corp which manufactures Buick, Chevrolet, and Cadillac vehicles. It has another venture, SGMW, with SAIC and Guangxi Automobile Group, that produces no-frills minivans and has started to make higher-end cars. Sales of GM’s mass-market brand Chevrolet dropped 55 percent for the latest quarter, while sales of the no-frills brand Wuling fell 34 percent. Premium brand Cadillac’s sales fell by 40 percent.
GM launched one new Chevrolet electric model in China this year and plans to offer four-cylinder engines in certain models currently offered only with smaller engines.
The number of New Energy Vehicles (NEVs) sold in China—excluding those from Tesla—fell for the ninth straight month to 53,000—down over 50 percent from a year earlier. NEVs are battery-powered electric, plug-in hybrid and hydrogen fuel-cell vehicles. China set a target for NEVs to account for 20 percent of auto sales by 2025, compared with 5 percent currently.
To make that happen, the Chinese government extended current subsidies and tax exemptions on electric vehicles. The subsidies for domestically built electric vehicles, which were previously to be phased out by the end of 2020, are extended for two more years. Electric vehicles will also continue to be exempt from a 10 percent sales tax through the end of 2022. The subsidies, however, will apply only to passenger cars costing less than 300,000 yuan ($42,376), which is likely to exclude premium electric vehicles such as Germany’s BMW and Mercedes Benz. Tesla’s China-made Model 3 sedans, which are currently priced at 323,800 yuan before subsidies, would have to undergo a price reduction to qualify for the incentives. The government will also increase the requirements for driving range and power efficiency of cars that qualify for the subsidies.
The Chinese government scaled back subsidies for electric vehicles in June 2019, with electric passenger vehicles qualifying for subsidies of up to 25,000 yuan ($3,521) and plug-in hybrids qualifying for a flat subsidy of 10,000 yuan. China plans to reduce these subsidies by 20 percent in 2021 and 30 percent in 2022.
China also cut value-added taxes on used-vehicle sales to stimulate light duty-vehicle demand. The value added tax on secondhand-vehicle sales was reduced to to 0.5 percent from 2.0 percent starting May 1 and will continue at that lower level until the end of 2023.
To reduce vehicle emissions in China’s capital city of Beijing and neighboring Tianjin city and Hebei province, the government is rolling out a bonus program for scrappage of local diesel trucks with emissions standards falling short of State 3 requirements, which are equivalent to the Euro 3 emission rules.
Local authorities have been trying to revive sales, with cities that rely heavily on vehicle manufacturing, such as Guangzhou in the south and Ningbo in the east, offering sales incentives. A survey of 204 manufacturing hubs showed 99.5 percent of plants have resumed output following closures aimed at stemming the spread of the coronavirus and 86 percent of employees have returned to work.
China’s car and light-truck production is expected to drop 12 percent this year to around 21.6 million units and rebound by 7.5 percent next year, according to research firm IHS Markit. China’s Association of Automobile Manufacturers, which expects China’s overall auto sales to drop 5 percent this year if the outbreak is contained by April, called on the government to help after industry-wide sales plunged a record 79 percent in February. China’s light-duty vehicle sales fell 8.2 percent last year, pressured by new emissions standards in a slowing economy as well as trade tension with the United States. The Ministry of Ecology and Environment is considering postponing the implementation of new gasoline emission standards in some provinces.
Conclusion
The automotive industry worldwide is being hit hard during the coronavirus pandemic with auto showrooms closed and auto manufacturers halting production due to stay-at-home policies and lock-down procedures. Auto sales are expected to come back slowly as lock-downs and stay-at-home policies are lifted. Some U.S. auto manufacturers are offering the ability for customers to purchase autos on-line, as Tesla has been doing. China is extending subsidies and tax credits on some vehicles to entice more sales of electric vehicles and used vehicles.
I couldn’t believe the response to my last post about coming up with content ideas in the B2C space during COVID-19. Thank you to all who read and commented — I truly hope it was helpful.
One piece of feedback we received was an ask to see some B2B content ideas, which, frankly, is an excellent subject. At first I was stumped about how to determine this, but then I decided that a different tool could do the trick.
Exploding Topics, the new tool by Brian Dean (Backlinko) and Josh Howarth, explores topics that are surging in popularity but haven’t hit their peak.
This time around, rather than focusing on specific keywords, I focused on overall trends so we can identify which categories might be of interest to your target businesses and their audiences. Then, you can examine whether these trends make sense for your niche and draw inspiration from them for your content.
All things remote
This trend obviously applies to B2C as well, but it’s an important consideration for B2B. Nearly everything has been either canceled, paused, or moved into the world of the virtual. For many companies and industries, this is uncharted territory, and they need guidance.
There is another category I could have included here that focuses on website and app development, programming, and the open source tools that help people build those types of assets as they lean more into digital.
If you’re not one of these B2B providers, there are still ways to gain inspiration from this data. Consider if your brand can provide:
The logistics of how to set up remote platforms
Best practices on how to make anything remote more successful and engaging
Comparison guides for different tools and solutions
The platform for people to lend the help and support they’re hoping to (like in the case of virtual tip jars)
Communication tips and solutions to help people stay productively connected
Shipping and delivery
Consumers are interested in having things shipped directly to them, but not everyone has the infrastructure to deal with shipping to begin with, let alone an increased order volume with the (understandable) safety limitations now in place.
Consumers and businesses alike are curious about how to make the shipping and delivery process more effective.
Consider if your brand can provide:
Guides for small businesses who’ve never had to ship product before
Tips on how companies can message shipping updates and delays to consumers
Advice on how to improve the delivery component of a business
UX or language tips for updating delivery messaging in apps or on websites
Transactions and payment
As we’re all staying six feet away from each other, we’re also trying not to hand off credit cards (let alone cash). Companies used to brick-and-mortar business models are also needing to adapt to fully digital payment systems.
Not all of these searches apply to business (like Venmo), but they do point to a concern everyone’s having: How do we pay for things now?
Consider if your brand can provide:
Answers about privacy or security questions people have regarding digital payments
A detailed list of all the payment options available
Advice on how to optimize storefronts and purchasing processes
Explanations of how payment processes can impact sales, and how to optimize them
Design tools
This section speaks to an overall trend I touched on before: Professionals now build their own assets if they can’t afford to hire web developers, designers, etc. More and more people are trying to figure out how to keep their businesses going when they can’t keep on as much staff or hire as many contractors.
Perhaps you can identify what your target audience might be struggling with and suggest free or inexpensive online tools to help.
Consider if your brand can provide:
A list of tools that can assist your target audience in communicating, organizing, creating, etc.
Design advice to help them get up to speed as quickly as possible
Resources in how to complete tasks on a smaller team
Recommendations for what should be prioritized when money is tight
Ethical trends
This is perhaps the most fascinating trend I saw arise. The four brands below have something in common: they all have to do with either sustainability or a transparent, mission-driven approach.
My theory is now that people don’t have as much disposable income, they’re becoming more mindful in their shopping choices, selecting items they believe match their own values.
Consider if your brand can provide:
A greater level of analysis on this potential trend
Research into how the consumer perspective has shifted during COVID-19
Advice on how to potentially shift marketing, branding, and advertising messaging
Tips on how your target audience can better understand their marketing during this tumultuous time
And finally (*sigh of relief*), marketing
Yes, as I was doing my research, my instinct that marketing would remain crucial during this time was confirmed.
That doesn’t mean you won’t lose business. We’ve had clients pull back because even though they’d like to keep marketing, keeping the company afloat by fulfilling their product orders and services and paying their employees will always (and very understandably) come first by a long shot.
But for businesses that can still afford marketing, they’ll likely need it, and they’re looking for the tools and insight they need to thrive.
Consider if your brand can provide:
Marketing 101 tips for smaller businesses
Specific how-to guides for different aspects of inbound or outbound marketing
Tool recommendations to help people get marketing tasks done quickly and cheaply
Advice on the kind of marketing that’s most successful during an economic downturn
Conclusion
Remember: This is only for inspiration. What matters most is what your target audience needs and wants. Put yourself in their shoes to be able to best address their challenges and concerns.
But hopefully some of these concepts spark some ideas for how your B2B brand can provide value to your target audiences. Companies around the world are looking for guidance and support now more than ever, and if you’re in a position to provide it to them, your content can go a long way in building trust.
Sign up for The Moz Top 10, a semimonthly mailer updating you on the top ten hottest pieces of SEO news, tips, and rad links uncovered by the Moz team. Think of it as your exclusive digest of stuff you don't have time to hunt down but want to read!
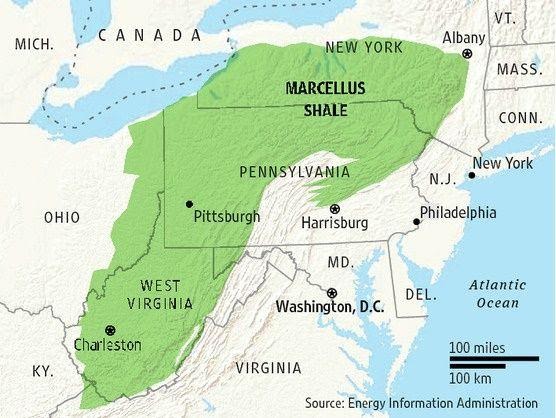
Several U.S. states—Vermont, Washington, Maryland, and New York—have banned the use of hydraulic fracturing technology to obtain oil and natural gas from shale basins, but among them, New York is the only state with enormous energy potential. Hydraulic fracturing technology spurred the energy renaissance in the United States and made the nation effectively energy independent in 2019 for the first time since the early 1950s. States such as Pennsylvania, West Virginia, and Ohio have benefited from the natural gas produced in the Marcellus basin, bolstering their economies and creating thousands of jobs. Despite having a section of the Marcellus shale basin in the state, New York produces less than 1 percent of the natural gas it consumes and imports the rest from outside its borders. Natural gas consumption in New York is large, being used for heating, electricity generation, and many industrial uses. Natural gas produced 40 percent of the state’s electricity last year and is expected to produce 50 percent of its electricity next year as a result of New York’s shuttering of the Indian Point nuclear power plant.
New York
New York’s ban on hydraulic fracturing cuts off about 12 million acres of the Marcellus Shale—an underground rock formation with natural-gas reserves that have helped fuel an energy-production boom in Pennsylvania, West Virginia, and Ohio. Local communities in New York were hoping to revive stagnating economies through the production of natural gas from the Marcellus. A dairy farmer in New York’s Southern Tier region, for example, had hoped that leasing land to energy companies would help pay property taxes on his 700 acres of farmland. But, because the state controls the most valuable part of his farm—the shale gas found beneath the surface, he is unable to capitalize on a lease sale.
Without hydraulic fracturing, New York produces less than one percent of the natural gas that it consumes. In 2018, New York produced 11,798 million cubic feet of natural gas (most recent production data available), while the state’s natural gas consumption that year was over 100 times as much, 1,323,836 million cubic feet, which means that New York needed to import 1.3 trillion cubic feet of natural gas from other states, most likely Pennsylvania. Using the natural gas prices from the Energy Information Administration for New York, the value of the natural gas consumed in 2018 was $10.77 billion, of which the majority, $10.67 billion, was imported from outside of New York at a value of $6.39 billion that was paid to the natural gas producers of another state. That means that New Yorkers were forced to send over $6 billion out of their state to buy a widely-used product that has been banned from being produced at home. It also means fewer jobs, both directly and indirectly, and less tax revenue for the state and local governments.
Pennsylvania
Due to the development of the Marcellus Shale, the largest U.S. natural gas field, Pennsylvania’s natural gas production totaled 6.2 trillion cubic feet in 2018, almost double its 2013 production. Pennsylvania produces about one-fifth of the nation’s national gas, making it the second-largest natural gas producer after Texas. Natural gas production has revitalized communities in the state, not only in production areas where new housing, hotels, restaurants, and other businesses have been established, but across the state due to a per-well impact fee that raised $1.7 billion for community projects, environmental programs and public safety initiatives.
The U.S. Chamber of Commerce evaluated what the impact would be of putting a ban on hydraulic fracturing in Pennsylvania. It found that Pennsylvania would lose $19 billion in state GDP in the first year of the ban and $261 billion in state GDP by 2025 if the ban was enacted out of an economy of $788.5 billion in 2018. Without hydraulic fracturing, there would be $23.4 billion less in state and local revenues by 2025, 125,000 jobs lost almost immediately, and 609,000 jobs lost by 2025. These are staggering losses of jobs and income
In contrast to New York, Pennsylvania consumed 1.2 trillion cubic feet of the 6.2 trillion cubic feet of natural gas it produced in 2018, leaving 5 trillion cubic feet of natural gas available for export to other states. With 105 trillion cubic feet of known natural gas reserves, the state can enjoy economic prosperity for a long while, particularly since as resources are developed, more reserves are found. Pennsylvania’s natural gas reserves at the end of 2018 were more than double the reserves it had at the end of 2013, despite having produced about 26 trillion cubic feet during that period.
Conclusion
Judging by the success of neighboring Pennsylvania, New York is hurting its economy and whole parts of the state by banning hydraulic fracturing, which would allow it to produce the natural gas that the state consumes for heating, electricity generation, and industrial uses. Further, it is likely that it would have excess natural gas that it could sell to other states, such as those in New England, which would further bolster its economy just as it did to Pennsylvania’s economy. With the Indian Point nuclear plants being shuttered, New York needs the natural gas now more than ever, and keeping it in the ground while denying its residents its benefits smacks of callousness.
When it boils down to it, every idea in SEO can be understood as a set of measurements we use to rank one page over another. And that means that when it comes to measuring a concept like the authoritativeness of your content, there are almost certainly factors that you can analyze and tweak to improve it.
But if Google were to use a measure of content authority, what might go into it? Against what yardstick should SEOs be measuring their content's E-A-T? In this episode of Whiteboard Friday, Russ Jones walks us through a thought experiment as to what exactly might constitute a "content authority" score and how you can begin to understand your content's expertise like Google.
Click on the whiteboard image above to open a high-resolution version in a new tab!
Video Transcription
Hey, folks, this is Russ Jones here with another Whiteboard Friday, and today we're going to have fun. Well, at least fun for me, because this is completely speculative. We're going to be talking about this concept of content authority and just some ideas around ways in which we might be able to measure it.
Maybe Google uses these ways to measure it, maybe not. But at the same time, hopefully what we'll be able to do is come up with a better concept of metrics we can use to get at content authority.
Now, we know there's a lot of controversy around this. Google has said quite clearly that expertise, authority, and trustworthiness are very important parts of their Quality Rater Guidelines, but the information has been pretty flimsy on exactly what part of the algorithm helps determine exactly this type of content.
We do know that they aren't using the quality rater data to train the algorithm, but they are using it to reject algorithm changes that don't actually meet these standards.
How do we measure the authoritativeness of content?
So how can we go about measuring content authority? Ultimately, any kind of idea that we talk about in search engine optimization has to boil down in some way, shape, or form to a set of measurements that are being made and in somehow shape or form being used to rank one page over another.
Now sometimes it makes sense just to kind of feel it, like if you're writing for humans, be a human. But authoritative content is a little bit more difficult than that. It's a little harder to just off the top of your head know that this content is authoritative and this isn't. In fact, the Quality Rater Guidelines are really clear in some of the examples of what would be considered really highly authoritative content, like, for example, in the News section they mention that it's written by a Pulitzer Prize winning author.
Well, I don't know how many of you have Pulitzer Prize winning authors on your staff or whose clients have Pulitzer Prize winning authors. So I don't exactly see how that's particularly helpful to individuals like ourselves who are trying to produce authoritative content from a position of not being an award-winning writer.
So today I want to just go through a whole bunch of ideas, that have been running through my head with the help of people from the community who've given me some ideas and bounced things off, that we might be able to use to do a better job of understanding authoritative content. All right.
1. ALBERT
So these are what I would consider some of the potential measures of authoritative content. The first one, and this is just going to open up a whole rat's nest I'm sure, but okay, ALBERT. We've talked about the use of BERT for understanding language by Google. Well, ALBERT, which stands for "a lighter BERT," is a similar model used by Google, and it's actually been trained in specific circumstances for the goal of answering questions.
Now that might not seem like a particularly big deal. We've been doing question answering for a whole long time. Featured snippets are exactly that. But ALBERT has jumped on the scene in such a dominant fashion as to have eclipsed anything we've really seen in this kind of NLP problem.
So if you were to go to the SQuAD dataset competition, which is Stanford's Question Answering competition, where they've got these giant set of questions and giant set of documents and then they had humans go in and find the answers in the documents and say which documents don't have answers and which do, and then all sorts of different organizations have produced models to try and automatically find the answers.
Well, this competition has just been going back and forth and back and forth for a really long time between a bunch of heavy hitters, like Google, Baidu, multiple Microsoft teams. We're talking the smartest people in the world, the Allen Institute, all fighting back and forth.
Well, right now, ALBERT or variations thereof have the top 5 positions and 9 of the top 10 positions, and all of them perform better than humans. That is dominance. So we've got right here this incredible technology for answering questions.
Well, what does this have to do with content authority? Why in the world would this matter? Well, if you think about a document, any kind of piece of content that we produce, the intention is that we're going to be answering the questions that our customers want answered. So any topic we start with, let's say the topic we started with was data science, well, there are probably a lot of questions people want to know about that topic.
They might want to know: What is a data scientist? How much money do they make? What kind of things do you need to know to be a data scientist? Well, this is where something like ALBERT could come in and be extremely valuable for measuring the authoritativeness of the content. You see, what if one of the measures of the authoritative content is how well that content answers all of the related questions to the topic?
So you could imagine Google looking at all of the pages that rank for data science, and they know the top 10 questions that are asked about it, and then seeing which piece of content answers those 10 questions best. If they were able to do that, that would be a pretty awesome metric for determining how thorough and how significant and valuable and useful and authoritative that content is.
So I think this one, the ALBERT algorithm really has a lot of potential. But let's move on from that. There are all sorts of other things that might have to do with content authority.
2. Information density
One that I really like is this idea of information density. So a lot of times when we're writing content, especially when we're not familiar with the topic, we end up writing a lot of fluff.
We kind of are just putting words in there to meet the word length that is expected by the contract, even though we know deep down that the number of words on the page really doesn't determine whether or not it's going to rank. So one of the ways that you can get at whether a piece of content is actually valuable or not or at least is providing important information is using natural language programs to extract information.
ReVerb + OpenIE
Well, the probably most popular NLP open source or at least openly available technology started as a project called ReVerb and now has merged into the Open IE project. But essentially, you can give it a piece of content, and it will extract out all of the factual claims made by that content.
So if I gave it a paragraph that said tennis is a sport that's played with a racket and a ball and today I'm having a lot of fun, something of that sort, it would be able to identify the factual claim, what tennis is, that it's a sport played with a racket and a ball.
But it would ignore the claim that I'm having a lot of fun today, because that's not really a piece of information, a factual claim that we're making. So the concept of information density would be the number of facts that can be extracted from a document versus the total number of words. All right.
If we had that measurement, then we could pretty easily sift through content that is just written for length versus content that is really information rich. Just imagine a Wikipedia article, how dense the information is in there relative to the type of content that most of us produce. So what are some other things?
3. Content style
Let's talk about content style.
This would be a really easy metric. We could talk about the use of in-line citations, which Wikipedia does, in which after stating a fact they then link to the bottom of the page where it shows you the citation, just like you would do if you were writing a paper in college or a thesis, something that would be authoritative. Or the use of fact lists or tables of contents, like Wikipedia does, or using datelines accurately or AP style formatting.
These are all really simple metrics that, if you think about it, the types of sites that are more trustworthy more often use. If that's the case, then they might be hints to Google that the content that you're producing is authoritative. So those aren't the only easy ones that we could look at.
4. Writing quality
There are a lot of other ones that are pretty straightforward, like dealing with writing quality.
How easy is it to make sure you are using correct spelling and correct grammar? But have you ever looked at the reading level? Has it ever occurred to you to make sure that the content that you're writing isn't written at a level so difficult that no one can understand it, or is written at a level so low as to be certainly not thorough and not authoritative? If your content is written at a third-grade level and the page is about some health issue, I imagine Google could use that metric pretty quickly to exclude your site.
There are also things like sentence length, which deals with readability, the uniqueness of the content, and also the word usage. This is a pretty straightforward one. Imagine that once again we're looking at data science, and Google looks at the words you use on your page. Then maybe instead of looking at all sites that mention data science, Google only looks at edu sites or Google only looks at published papers and then compares the language usage there.
That would be a pretty easy way for Google to identify a piece of content that's meant for consumers that is authoritative versus one that's meant for consumers and isn't.
5. Media styles
Another thing we can look at is media styles. This is something that is a little bit more difficult to understand how Google might actually be able to take advantage of.
But at the same time, I think that these are measurable and easy for search engine optimizers, like ourselves, to use.
Annotated graphs
One would be annotated graphs. I think we should move away from graph images and move more towards using open source graphing libraries. That way the actual factual information, the numbers can be provided to Google in the source code.
Unique imagery
Unique imagery is obviously something that we would care about. In fact, it's actually listed in the Quality Rater Guidelines.
Accessibility
Then finally, accessibility matters. I know that accessibility doesn't make content authoritative, but it does say something about the degree to which a person has cared about the details of the site and of the page. There's a really famous story about, and I can't remember what the band's name was, but they wrote into their contracts that for every concert they needed to have a bowl of M&Ms, with all of the brown M&Ms removed, waiting for them in the room.
Now it wasn't because they had a problem with the brown M&Ms or they really liked M&Ms or anything of that sort. It was just to make sure that they read the contract. Accessibility is kind of one of those things of where they can tell if you sweat the details or not.
6. Clickbait titles, author quality, and Google Scholar
Now finally, there are a couple of others that I think are interesting and really have to be talked about. The first is clickbait titles.
Clickbait titles
This is explicitly identified as something that Google looks at or at least the quality raters look at in order to determine that content is not authoritative. Make your titles say what they mean, not try to exaggerate to get a click.
Author quality
Another thing they say specifically is do you mention your author qualifications. Sure, you don't have a Pulitzer Prize writer, but your writer has some sort of qualifications, at least hopefully, and those qualifications are going to be important for Google in assessing whether or not the author actually knows what they're talking about.
Google Scholar
Another thing that I think we really ought to start looking at is Google Scholar. How much money do you think Google makes off of Google Scholar? Probably not very much. What's the point of having a giant database of academic information when you don't run ads on any of the pages? Well, maybe that academic information can be mined in a way so that they can judge the content that is made for consumers as to whether or not it is in line with, whether we're talking about facts or language or authoritativeness, with what academia is saying about that same topic.
Now, course, all of these ideas are just ideas. We've got a giant question mark sitting out there about exactly how Google gets at content authority. That doesn't mean we should ignore it. So hopefully these ideas will help you come up with some ideas to improve your own content, and maybe you could give me some more ideas in the comment section.
That would be great and we could talk more about how those might be measured. I'm looking forward to it. Thanks again.
Sign up for The Moz Top 10, a semimonthly mailer updating you on the top ten hottest pieces of SEO news, tips, and rad links uncovered by the Moz team. Think of it as your exclusive digest of stuff you don't have time to hunt down but want to read!
On April 20, 2010, ten years ago, a “blowout” occurred on the Deepwater Horizon offshore rig, killing 11 workers and spilling millions of barrels of oil from BP’s Macondo well in the Gulf of Mexico. Four million barrels of oil flowed from the damaged well over an 87-day period, before it was capped on July 15, 2010. Shortly after the accident, President Obama instituted a six-month moratorium on deep-water offshore drilling. On December 15, 2010, the United States filed a complaint in District Court against BP Exploration & Production and several other defendants alleged to be responsible for the spill. Settlements were made with several of the defendants, including the settlement with BP Exploration & Production for a $5.5 billion Clean Water Act penalty and up to $8.8 billion in natural resource damages. As of 2018, BP had spent $65 billion on the spill. Since the accident, the offshore drilling industry has taken significant preventative actions.
Industry Actions
In 2011, the American Petroleum Institute founded the Center for Offshore Safety in Houston to promote the highest level of safety for offshore operations through a program that addresses management practices, communication, and teamwork. The center provides tools, good practices, and implementation techniques, and collects and publishes safety performance data from its members annually.
In 2010, some of the equipment that was needed to stop the flow of oil had to be built from scratch. Today, before a company can drill for oil, that equipment is standing by in case of an emergency. Two companies are on alert and have the equipment to respond: Marine Well Containment Company (MWCC), which covers large firms such as BP, Shell, ExxonMobil, Chevron, and Conoco and HWCG, which serves smaller independent oil companies. In 2010, four companies originally spent $1 billion to create MWCC and six more have joined since then, spending hundreds of millions of dollars on equipment and training.
At MWCC’s facility near Corpus Christi, Texas, there are five capping stacks that are used for different ocean depths, pressures, and temperatures. They are about two stories tall and weigh as much as 40 full-sized SUVs. If the oil flow cannot be immediately stopped, MWCC can use equipment to capture the oil put it in tankers and bring it onshore until a relief well can be drilled to stop the flow.
Regulatory Agency
A new federal regulatory agency was created in 2011—the Bureau of Safety and Environmental Enforcement (BSEE). The agency issued the Well Control Rule in 2016—a complex collection of regulations designed to prevent future blowouts, providing oil drillers detailed requirements to safely drill an offshore well. The Trump administration modified the rule in 2019 to be more attuned to the different characteristics of the industry.
According to the agency’s current director, compared to the past six years, the agency increased the number of inspections by 26 percent, increased the number of inspections per facility by 86 percent, and increased the numbers of inspectors by 12 percent.
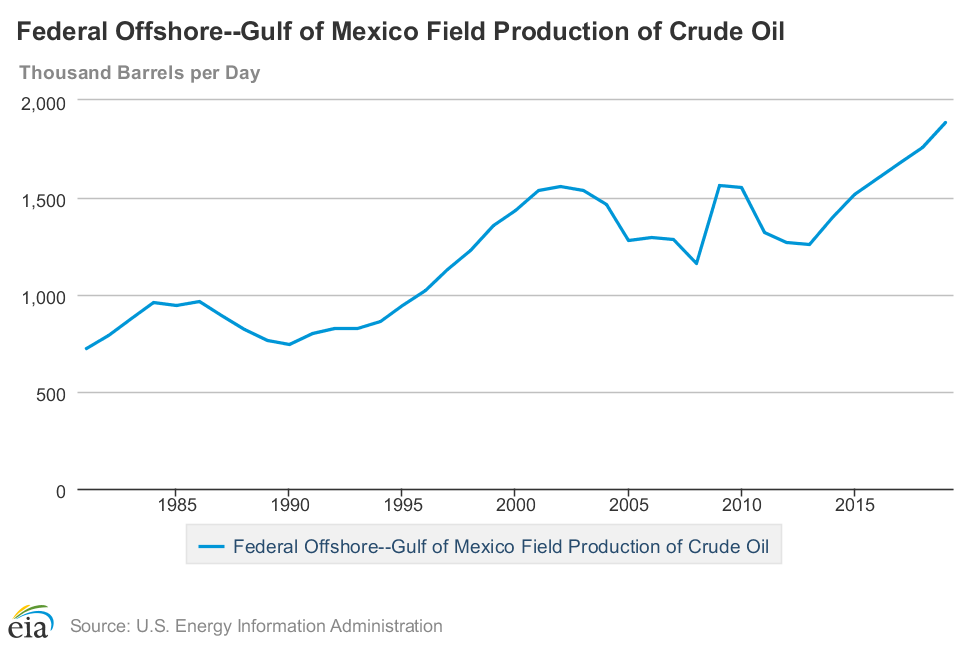
Offshore Gulf of Mexico Oil Production
Offshore oil production in the U.S. Gulf of Mexico has been increasing since 2013 when it hit its lowest level of production after the Deep Water Horizon accident. In 2019, offshore oil production totaled almost 2 million barrels per day, increasing by 50 percent since 2013. In 2019, the Federal offshore Gulf of Mexico produced 15 percent of total U.S. oil production.
In the past decade, there has not been another major offshore oil spill in the United States like the Deepwater Horizon event. In fact, the two companies standing by to cap a well blowout have never even deployed their billions of dollars’ worth of equipment for anything other than drills. That shows that the safety measures undertaken by the industry are working to prevent another blowout. The offshore Gulf of Mexico is an important source of U.S. oil, supplying 15 percent of the nation’s oil—an important part of our national energy security.
Kenny Stein, IER’s Policy Director, joins the show to discuss the recent downturn in oil futures prices. Kenny provides an overview of what the negative prices actually mean and what good a good public policy response would look like.
Often in SEO, we get so preoccupied with technical SEO (pagination, site speed, the latest Python course, etc.) that we forget the basis of winning SEO begins and ends with keywords.
Not choosing keywords before you start with SEO means shooting in the dark — a likely losing gamble if your content will succeed or not.
Choosing the wrong keywords means wasting your time and budget on content that will never gain visibility in search results.
Conversely, choosing smart, targeted keywords can help carve out and dominate a traffic niche that raises you above the competition.
No doubt, the difference between good SEOs and mediocre SEOs is often their keyword research strategy.
Here at Moz, a question we often hear after people finish reading the famous Beginner's Guide to SEO is: What do I read next?
To give people a practical place to start, we wanted to provide you with concrete keyword research workflows. It's as if you're looking over our shoulder as we do strategic keyword research.
We also included a few intermediate-to-advanced concepts, such as keyword grouping, understanding keyword priority, and on-page keyword optimization.
And finally, we wanted to make sure it was free.
If you want, feel free to jump to the guide now, or read below about what the guide covers and how it differs from any other guide on keyword research.
We call them "seed" keywords because all your other keywords grow out of them. Finding the right seed keywords will absolutely make or break your entire keyword research strategy.
Finding the right seed keywords is about asking and answering three key questions:
What do you think you want to rank for?
What do you already rank for?
What do your competitors rank for?
After this, you validate your answers with data to find the absolute best seeds.
We also show you the exact process and tools we use to extract these seeds, such as Google Search Console (shown below).
The cool thing about seed keywords is this: they grow more seeds! Once you find the right seeds, you can reiterate the process again and again to grow a complete keyword strategy for an entire site, even one that's thousands of pages.
This is where the rubber hits the road. Here you expand your seed keywords into complete lists. These lists support multiple pages and topics, and can even grow more seeds.
This is also the place you want to be as comprehensive as possible, in order to uncover the opportunities your competition probably missed.
Nearly any old keyword tool can give you lists of hundreds or thousands of keywords. The secret to success is knowing which keywords to prioritize and pursue.
Which keywords will actually prove profitable? Which keywords can you actually rank for?
To answer these questions, we do a deep dive into the keyword metrics that help us to prioritize our keyword lists:
Relevance
Monthly volume
Keyword difficulty
Organic click-through rate (CTR)
Priority
Understanding how to use these metrics goes a long way in choosing the exact right keywords to invest in.
Keywords never exist in a vacuum. Instead, they almost always appear with other keywords.
Adding related keywords to a page is a smart strategy for increasing topical relevance. At the same time, trying to target too many keywords on the same page may dilute their relevance and make it more difficult to rank.
Here, we show you techniques to address both of these problems:
When to create separate pages for each keyword
How to group related keywords together
We'll also show you some grouping tips to help set you up for your next task: on-page keyword optimization.
Very few keyword research guides ever even mention on-page keyword optimization.
We wanted to do better.
Because keyword research uncovers intent, this is a great starting point for on-page optimization. If you understand not only what your users are searching for, but also what they expect to find, you can better create your content to satisfy their expectations.
We've also included a brief overview of where and how to incorporate keywords on the page. While this section is mostly beginner level, more immediate SEOs should find the refresher useful.
If you’re a consultant, agency, in-house SEO, or simply work for yourself, you want to know how your keywords perform in search engines.
Traditionally, keyword tracking was synonymous with "ranking" — but times have changed. Today, with personalization, localization, and shifting competitive environments, keyword tracking has grown much more sophisticated.
In this chapter, we'll cover:
Traditional keyword ranking
Local rank tracking
Rank indexes
Share of Voice (SOV) and visibility
By the end of this chapter, you'll understand which type of keyword tracking is right for you, and how to report these numbers to the people who matter.
We couldn't squeeze everything in the previous chapters, so we added all our extra resources here. The crème de la crème is the Keyword Research Cheat Sheet. You can download, print, share with your team, or pin to your wall.
We've also made a handy list of our favorite keyword research tools, along with a few other useful resources on keyword research.
We hope you enjoy! Let us know what you think in the comments below.
Sign up for The Moz Top 10, a semimonthly mailer updating you on the top ten hottest pieces of SEO news, tips, and rad links uncovered by the Moz team. Think of it as your exclusive digest of stuff you don't have time to hunt down but want to read!
The 50th anniversary of Earth Day should be celebrated for the preponderance of good news, not bad. In so doing, Earth Day should be renamed Resourceful Earth Day in remembrance of Julian Simon, who did much to bring into question, if not refute, Malthusianism.
Simon was once a Malthusian, believing that more people meant more problems. But the “statistics expert and data hound” found a recurring anomaly: a positive correlation between population and progress. The result would be a book published by Princeton University Press in 1981, The Ultimate Resource, which boldly featured four bullets on the cover:
Natural resources are energy and getting less scarce.
Pollution in the U.S. has been decreasing.
The world’s food supply is improving.
Population growth has long-term benefits….
The inside cover began:
Quackery? Foolishness? Lying propaganda? Decide for yourself.
Regarding resources (including mineral resources):
… the author demonstrates that natural resources are not “finite” in any meaningful way, and that using such resources now will not slow the rate of future economic growth. In the short run, he explains, all resources are limited. A greater use of any resource means pressure on its supply and hence an increased price. In the long run, however, history shows that human creativity overcomes natural obstacles to economic growth, and leads to a lower cost and price than before.
The summary concludes:
In the author’s view, the primary constraint on our national and world economic growth is our capacity for the creation of new ideas and contributions to knowledge. The more people alive who can be trained to help solve the problems that confront us, the faster we might remove the obstacles and the greater the economic inheritance we can bequeath to our descendants. The ultimate resource, Professor Simon concludes, is the human imagination coupled to the human spirit.
Add four words at the end—in a free society—and the Simon worldview is complete.
Simon’s work punctured Malthusianism in its different iterations, including:
Fred Smith Jr., the founder and longtime head of the Competitive Enterprise Institute, was a champion of Julian Simon and Resourceful Earth Day. “April 22, once associated with the optimism of revolutionary Marxism (as the birthday of Lenin) and then with the pessimism of modern Malthusianism (as the environmentalist’s Earth Day since 1970), merits redemption,” Smith wrote back in 1999. “A new label, Resourceful Earth Day, is appropriate as we enter the 21st century, a title selected to honor mankind’s increasing ability to solve environmental as well as economic problems.” Well said.
According to the International Energy Agency (IEA), U.S. carbon dioxide emissions fell 2.9 percent (140 million metric tons) in 2019—the largest decline in energy-related carbon dioxide emissions of any country. The U.S. drop in emissions is mainly due to gas-fired generation replacing coal-fired generation as a result of lower natural gas prices. According to the Energy Information Administration, U.S. carbon dioxide emissions are now 14 percent (861 million metric tons) below their 2005 levels, which is the largest absolute decline by any country over that period. The United States is reducing carbon dioxide emissions despite having rejected the Paris Agreement, which President Trump announced he was withdrawing from in 2017.
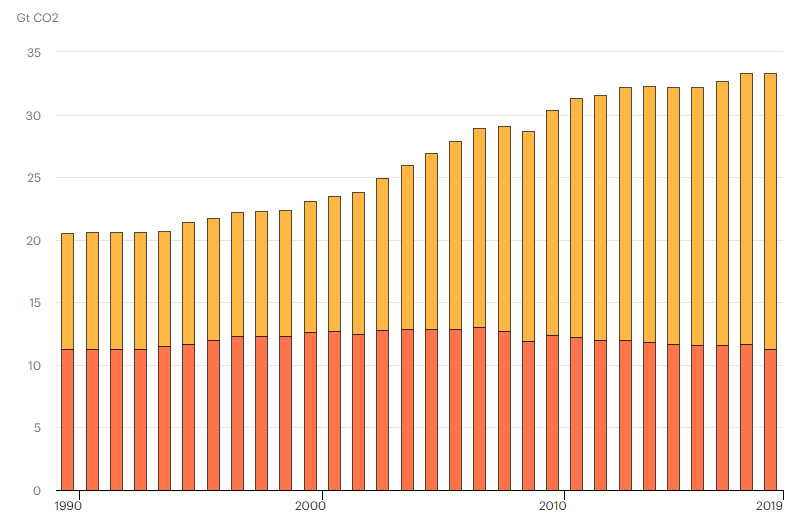
Globally, IEA indicates energy-related carbon dioxide emissions flattened in 2019, following two years of increases. The flattening resulted primarily from a decline in carbon dioxide emissions from the power sector in advanced economies due to the addition of renewable (mainly wind and solar PV) capacity, fuel switching from coal to natural gas, and higher nuclear power output.
Global Energy-Related Carbon Dioxide Emissions, 1990-2019
Nearly all of the decrease in carbon dioxide emissions in 2019 was due to fewer emissions from coal consumption—a decline of 14 percent in coal-related carbon dioxide emissions. Carbon dioxide emissions from natural gas increased by 3.2 percent and carbon dioxide emissions from petroleum declined by less than 1 percent.
The lower coal-fired emissions result from the electric power sector, which consumes 91 percent of the coal used in the United States. In 2019, electricity demand fell by 1.3 percent and coal-generated 16 percent less electricity, resulting in fewer coal carbon dioxide emissions. Coal’s share of electricity generation dropped to 23 percent in 2019 from 27 percent in 2018, while gas-fired generation increased its share to 38 percent—up from 35 percent in 2018. Although the electric power sector is using more natural gas, the increase in natural gas emissions in 2019 do not offset the decrease in coal emissions because natural gas-fired electricity generation is less carbon-intensive than coal-fired electricity generation.
According to the Energy Information Administration, the electric power sector installed nearly 23,000 megawatts of new generating capacity in 2019. The new capacity was primarily onshore wind (9,100 megawatts), natural gas (8,300 megawatts), and solar photovoltaic (5,300 megawatt) capacity. Wind and solar increased their combined share of generation to 9 percent in 2019 from 8 percent in 2018. Despite adding more capacity than natural gas, wind turbines and solar PV did not increase their generation share as much as natural gas because their capacity factors are much lower than that of natural gas—meaning that wind and solar power generate much less electricity per unit of capacity than natural gas combined cycle technology. Wind and solar are also intermittent technologies, meaning that they are not available 24/7 as the more traditional technologies are. They only work when nature allows, rather than working when there is a demand for their electricity.
Global Emissions
According to the IEA, global carbon dioxide emissions from coal use declined by almost 200 million metric tons, or 1.3 percent from 2018 levels, offsetting increases in emissions from oil and natural gas. Carbon dioxide emissions in advanced economies declined by over 370 million metric tons (3.2 percent), with the power sector responsible for 85 percent of the decline. Milder weather in many large economies resulted in reducing emissions by around 150 million metric tons from 2018 levels. Weaker global economic growth moderated the increase in carbon dioxide emissions in major emerging economies such as India.
Global carbon dioxide emissions from the power sector declined by about 170 million metric tons (1.2 percent) with the largest drops occurring in advanced economies where carbon dioxide emissions are now at levels not seen since the late 1980s (when electricity demand was one-third lower). The global power sector now accounts for 36 percent of energy-related carbon dioxide emissions across advanced economies, down from a high of 42 percent in 2012.
Generation from coal-fired plants in advanced economies declined by nearly 15 percent as a result of continued growth of renewables, coal-to-gas fuel switching, an increase in nuclear power and weaker electricity demand. The growth of renewables in electricity generation in advanced economies resulted in 130 million metric tons of carbon dioxide emissions savings in 2019. Wind accounted for the largest share of the increase, with output expanding 12 percent from 2018 levels. Solar PV saw the fastest growth amongst renewable sources, helping to push renewables’ share of total global electricity generation close to 28 percent. Coal-to-gas fuel switching for power generation avoided 100 million metric tons of carbon dioxide in advanced economies. Higher nuclear power generation in advanced economies, particularly in Japan and South Korea, avoided over 50 million metric tons of carbon dioxide.
Conclusion
Global energy-related carbon dioxide emissions flattened in 2019 as advanced economies reduced emissions enough to balance out increasing carbon dioxide emissions from developing economies. The United States led all countries in reducing carbon dioxide emissions in 2019 due to less coal-fired generation and lower electricity demand, with less carbon-intensive and lower-cost natural gas generation primarily replacing coal-fired generation. The United States leads by example, rather than by an international agreement that compels us to do so.