Tuesday, October 31, 2017

Unfiltered: How to Show Up in Local Search Results

Posted by sherrybonelli

If you're having trouble getting your local business' website to show up in the Google local 3-pack or local search results in general, you're not alone. The first page of Google's search results seems to have gotten smaller over the years – the top and bottom of the page are often filled with ads, the local 7-pack was trimmed to a slim 3-pack, and online directories often take up the rest of page one. There is very little room for small local businesses to rank on the first page of Google.

To make matters worse, Google has a local "filter" that can strike a business, causing their listing to drop out of local search results for seemingly no reason – often, literally, overnight. Google's local filter has been around for a while, but it became more noticeable after the Possum algorithm update, which began filtering out even more businesses from local search results.

If you think about it, this filter is not much different than websites ranking organically in search results: In an ideal world, the best sites win the top spots. However, the Google filter can have a significantly negative impact on local businesses that often rely on showing up in local search results to get customers to their doors.

What causes a business to get filtered?

Just like the multitude of factors that go into ranking high organically, there are a variety of factors that go into ranking in the local 3-pack and the Local Finder.

https://d2eeipcrcdle6.cloudfront.net/learn/seo/Algo-update-pages/Google-Possum1.png?mtime=20170612120640

Here are a few situations that might cause you to get filtered and what you can do if that happens.

Proximity matters

With mobile search becoming more and more popular, Google takes into consideration where the mobile searcher is physically located when they're performing a search. This means that local search results can also depend on where the business is physically located when the search is being done.

A few years ago, if your business wasn't located in the large city in your area, you were at a significant disadvantage. It was difficult to rank when someone searched for "business category + large city" – simply because your business wasn't physically located in the "large city." Things have changed slightly in your favor – which is great for all the businesses who have a physical address in the suburbs.

According to Ben Fisher, Co-Founder of SteadyDemand.com and a Google Top Contributor, "Proximity and Google My Business data play an important role in the Possum filter. Before the Hawk Update, this was exaggerated and now the radius has been greatly reduced." This means there's hope for you to show up in the local search results – even if your business isn't located in a big city.

Google My Business categories

When you're selecting a Google My Business category for your listing, select the most specific category that's appropriate for your business.

However, if you see a competitor is outranking you, find out what category they are using and select the same category for your business (but only if it makes sense.) Then look at all the other things they are doing online to increase their organic ranking and emulate and outdo them.

If your category selections don't work, it's possible you've selected too many categories. Too many categories can confuse Google to the point where it's not sure what your company's specialty is. Try deleting some of the less-specific categories and see if that helps you show up.

Your physical address

If you can help it, don't have the same physical address as your competitors. Yes, this means if you're located in an office building (or worse, a "virtual office" or a UPS Store address) and competing companies are also in your building, your listing may not show up in local search results.

When it comes to sharing an address with a competitor, Ben Fisher recommends, "Ensure that you do not have the same primary category as your competitor if you are in the same building. Their listing may have more trust by Google and you would have a higher chance of being filtered."

Also, many people think that simply adding a suite number to your address will differentiate your address enough from a competitor at the same location — it won't. This is one of the biggest myths in local SEO. According to Fisher, "Google doesn't factor in suite numbers."

Additionally, if competing businesses are located physically close to you, that, too, can impact whether you show up in local search results. So if you have a competitor a block or two down from your company, that can lead to one of you being filtered.

Practitioners

If you're a doctor, attorney, accountant or are in some other industry with multiple professionals working in the same office location, Google may filter out some of your practitioners' listings. Why? Google doesn't want one business dominating the first page of Google local search results. This means that all of the practitioners in your company are essentially competing with one another.

To offset this, each practitioner's Google My Business listing should have a different category (if possible) and should be directed to different URLs (either a page about the practitioner or a page about the specialty – they should not all point to the site's home page).

For instance, at a medical practice, one doctor could select the family practice category and another the pediatrician category. Ideally you would want to change those doctors' landing pages to reflect those categories, too:

Doctorsoffice.com/dr-mathew-family-practice
Doctorsoffice.com/dr-smith-pediatrician

Another thing you can do to differentiate the practitioners and help curtail being filtered is to have unique local phone numbers for each of them.

Evaluate what your competitors are doing right

If your listing is getting filtered out, look at the businesses that are being displayed and see what they're doing right on Google Maps, Google+, Google My Business, on-site, off-site, and in any other areas you can think of. If possible, do an SEO site audit on their site to see what they're doing right that perhaps you should do to overtake them in the rankings.

When you're evaluating your competition, make sure you focus on the signals that help sites rank organically. Do they have a better Google+ description? Is their GMB listing completely filled out but yours is missing some information? Do they have more 5-star reviews? Do they have more backlinks? What is their business category? Start doing what they're doing – only better.

In general Google wants to show the best businesses first. Compete toe-to-toe with the competitors that are ranking higher than you with the goal of eventually taking over their highly-coveted spot.

Other factors that can help you show up in local search results

As mentioned earlier, Google considers a variety of data points when it determines which local listings to display in search results and which ones to filter out. Here are a few other signals to pay attention to when optimizing for local search results:

Reviews

If everything else is equal, do you have more 5-star reviews than your competition? If so, you will probably show up in the local search results instead of your competitors. Google is one of the few review sites that encourages businesses to proactively ask customers to leave reviews. Take that as a clue to ask customers to give you great reviews not only on your Google My Business listing but also on third-party review sites like Facebook, Yelp, and others.

Posts

Are you interacting with your visitors by offering something special to those who see your business listing? Engaging with your potential customers by creating a Post lets Google know that you are paying attention and giving its users a special deal. Having more "transactions and interactions" with your potential customers is a good metric and can help you show up in local search results.

Google+

Despite what the critics say, Google+ is not dead. Whenever you make a Facebook or Twitter post, go ahead and post to Google+, too. Write semantic posts that are relevant to your business and relevant to your potential customers. Try to write Google+ posts that are approximately 300 words in length and be sure to keyword optimize the first 100 words of each post. You can often see some minor increases in rankings due to well-optimized Google+ posts, properly optimized Collections, and an engaged audience.

Here's one important thing to keep in mind: Google+ is not the place to post content just to try and rank higher in local search. (That's called spam and that is a no-no.) Ensure that any post you make to Google+ is valuable to your end-users.

Keep your Google My Business listing current

Adding photos, updating your business hours for holidays, utilizing the Q&A or booking features, etc. can help you show off in rankings. However, don't add content just to try and rank higher. (Your Google My Business listing is not the place for spammy content.) Make sure the content you add to your GMB listing is both timely and high-quality content. By updating/adding content, Google knows that your information is likely accurate and that your business is engaged. Speaking of which...

Be engaged

Interacting with your customers online is not only beneficial for customer relations, but it can also be a signal to Google that can positively impact your local search ranking results. David Mihm, founder of Tidings, feels that by 2020, the difference-making local ranking factor will be engagement.

engagement-ranking-factor.jpg

(Source: The Difference-Making Local Ranking Factor of 2020)

According to Mihm, "Engagement is simply a much more accurate signal of the quality of local businesses than the traditional ranking factors of links, directory citations, and even reviews." This means you need to start preparing now and begin interacting with potential customers by using GMB's Q&A and booking features, instant messaging, Google+ posts, responding to Google and third-party reviews, ensure your website's phone number is "click-to-call" enabled, etc.

Consolidate any duplicate listings

Some business owners go overboard and create multiple Google My Business listings with the thought that more has to be better. This is one instance where having more can actually hurt you. If you discover that for whatever reason your business has more than one GMB listing, it's important that you properly consolidate your listings into one.

Other sources linking to your website

If verified data sources, like the Better Business Bureau, professional organizations and associations, chambers of commerce, online directories, etc. link to your website, that can have an impact on whether or not you show up on Google's radar. Make sure that your business is listed on as many high-quality and authoritative online directories as possible – and ensure that the information about your business – especially your company's Name, Address and Phone Number (NAP) -- is consistent and accurate.

So there you have it! Hopefully you found some ideas on what to do if your listing is being filtered on Google local results.

What are some tips that you have for keeping your business "unfiltered"?


Sign up for The Moz Top 10, a semimonthly mailer updating you on the top ten hottest pieces of SEO news, tips, and rad links uncovered by the Moz team. Think of it as your exclusive digest of stuff you don't have time to hunt down but want to read!
U.S. to Become a Major LNG Exporter

There is currently only one operational liquefied natural gas (LNG) export terminal in the United States; it has been operating since early 2016. Cheniere Energy is exporting LNG at its Sabine Pass facility with three trains and a capacity of about 2 billion cubic feet per day. Its total capacity is expected to be 3.5 billion cubic feet per day when all 5 trains are completed. Cheniere is in the process of getting contracts and financing for a sixth train.

There are five additional LNG projects under construction with a total capacity of about 7.5 billion cubic feet per day that will come online in 2018 and 2019, making total U.S. LNG export capacity about 10 or 11 billion cubic feet per day within just a few years. Four more projects with a capacity of almost 7 billion cubic feet per day are approved but not yet under construction. These terminals will make the United States one of the top three LNG exporters in the world; the other two major exporters are Australia and Qatar.[i] Australia is expected to overtake Qatar as the world’s largest LNG exporter by 2020.[ii]

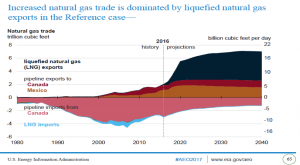
Between 2016 and 2020, the United States is expected to account for about half of the 20 billion cubic feet per day of new LNG export capacity worldwide. (Worldwide LNG demand is now around 37 billion cubic feet per day.) The Energy Information Administration expects that U.S. LNG exports will exceed 3 billion cubic feet per day in 2018 and over 12 billion cubic feet per day by 2035. (See graph below.) LNG exports are expected to support up to 452,000 new jobs and add $73 billion to the U.S. economy by 2040.[iii]

Source: EIA, https://www.eia.gov/outlooks/aeo/pdf/0383(2017).pdf

Below is a description and status of the LNG export facilities under construction and the date when they are expected to come online.

Sabine Pass, Louisiana

Currently, Sabine Pass is the only active LNG export terminal in the United States. It has three operational trains, and a fourth train expected to be operational this month. Also, a fifth train is expected to be completed in August 2019. The construction of a sixth and final train is subject to the availability of commercial contracts and financing. Each train has a capacity of 0.7 billion cubic feet per day.

Cove Point, Maryland

The Cove Point terminal is expected to be operational by the end of this year. It was constructed by Dominion Energy as an import terminal but is being retooled as an export terminal. Its capacity will be 0.82 billion cubic feet per day.

Cameron LNG, Louisiana

Cameron LNG owned by Sempra Energy is scheduled to begin operation in 2018. It has three trains currently under construction. The first train is expected to begin operation in early 2018, and the second and third trains are expected to start up during the second half of 2018. The three trains will have a capacity of 2.1 billion cubic feet per day.

Sempra Energy is also in the permitting stage of constructing an expansion to the facility, which would add a fourth and fifth train. Project completion for the expansion is expected sometime in 2019.

Elba Island, Georgia

Elba Island is a relatively small-scale facility owned by Kinder Morgan with a capacity of 0.35 billion cubic feet per day. It was originally constructed as a regasification plant for imports of LNG and it is being retooled as an export facility. The project will use ten small scale liquefaction units, constructed in two phases. The first phase will begin service in mid-2018, while the second will come online in early 2019.

Freeport LNG, Texas

Freeport LNG is a larger facility with three trains currently under construction, which will begin operation between the end of 2018 and the third quarter of 2019, with a combined capacity of 2.14 billion cubic feet per day. A fourth train is under development.

Corpus Christi, Texas

Corpus Christi is the sixth facility currently under construction on 1,000 acres owned or controlled by Cheniere Energy. It is being designed for five trains and is located on the La Quinta Channel on the northeast side of Corpus Christi Bay, about 15 nautical miles from the coast.[iv] Construction on the first and second trains began in May 2015. The first train is expected to begin operating in the first half of 2019. About 5,000 construction workers are working on the first three trains which will have a combined capacity of 2.14 billion cubic feet per day. The facility is currently 70 percent complete.[v]

Global LNG Demand

As countries look to diversify their fuels, natural gas is becoming a fuel of choice mostly for industrial and electric power uses. It is expected that LNG trade, which increased by 22 percent in the last three years, will increase another 21 percent by 2020. There are currently 170 LNG tankers supplying foreign ports—20 more than a year ago. And, making it easier to supply Asia, the Panama Canal was widened to handle larger LNG vessels.[vi]

There are now floating LNG facilities that cost less than on-shore facilities to construct, are built more quickly and can be moved to where they are needed most. Currently, there are 25 floating facilities worldwide—the first of which came online in 2005.

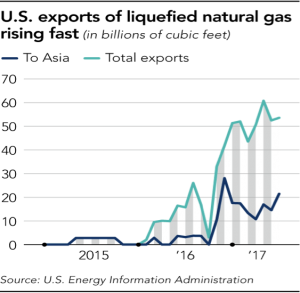
In 2005, only 15 countries imported LNG. That number has more than tripled in twelve years.[vii] But, the bulk of the demand growth is expected to come from Asia. Asian LNG prices are their lowest in more than a decade. Favorable prices along with low U.S. transport costs to Asia have increased Asia’s demand for LNG and for U.S. LNG exports. U.S. exports of LNG to Asia increased 12 times during the first seven months of 2017. [viii]

Source: https://asia.nikkei.com/Politics-Economy/Economy/Rising-US-energy-exports-could-prompt-seismic-shift-in-Asian-market

China is planning to increase its share of natural gas in its energy mix from a targeted 10 percent by 2020 to 15 percent by 2030.[ix] While China’s natural gas consumption and production have both increased over the past decade, a supply gap has widened substantially since 2009. In the first half of 2017, China’s natural gas consumption increased 15 percent over the prior year reaching 115 billion cubic meters. To supply the gap, China gets natural gas both via pipeline imports and LNG. Its demand for LNG increased more than 40 percent over the past year.[x]

In the first seven months of 2017, the United States exported $139 million of LNG to China, surpassing its 2016 exports by two percent ($137 million).[xi] As part of the US-China 100-Day Action Plan, the United States and China agreed to allow Chinese buyers to secure long-term contracts and purchase LNG supplies from the United States directly rather than through third parties.[xii]

But China is not the only Asian country to want to increase its LNG usage. East Asia’s demand for LNG is expected to double by 2030 and some $80 billion in infrastructure is needed to meet that demand.[xiii] Japan has been making significant investments in LNG terminal infrastructure since LNG is helping to replace the country’s nuclear power. Recently, Japan has announced that it will invest $10 billion in a public-private initiative to support the expansion of Asia’s LNG markets.[xiv]

Conclusion

The United States is poised to become one of the top 3 LNG exporters along with Australia and Qatar. LNG export facilities are under construction and in the next few years the United States will have 10 or 11 billion cubic feet per day of LNG capacity. Countries are looking toward U.S. LNG as a secure supply of natural gas as they plan to use more of the fuel to decrease emissions and diversify their fuel mix.


[i] Federal Energy Regulatory Commission, North American LNG Import/Export Terminals Approved, May 1, 2017, https://www.ferc.gov/industries/gas/indus-act/lng/lng-approved.pdf

[ii] Hydrocarbon Report, An LNG Horse Race, August 25, 2017, http://hydrocarbonreports.com/archives/866608/866608

[iii] Gas to Power Journal, LNG exports could add up to $73bn to U.S. economy by 2040, October 5, 2017, https://gastopowerjournal.com/markets/item/7783-lng-exports-could-add-up-to-73-billion-to-u-s-economy-by-2040

[iv] Corpus Christi LNG, http://www.cheniere.com/terminals/corpus-christi-project/

[v] Corpus Christi, Cheniere LNG plant 70 percent complete, October 24, 2017, https://www.101corpuschristi.com/news/cheniere-lng-plant-70-percent-complete

[vi] New American, U.S. Natural Gas Exports to Add 500,000 Jobs, $73 Billion to Economy, October 16, 2017, https://www.thenewamerican.com/tech/energy/item/27141-us-natural-gas-exports-to-add-500-000-jobs-73-billion-to-economy

[vii] New York Times, Boom in American Liquefied Natural Gas Is Shaking Up the Energy World, October 16, 2017, https://www.nytimes.com/2017/10/16/business/energy-environment/liquified-natural-gas-world-markets.html?_r=0

[viii] NIKKEI Asian Review, Rising US energy exports could prompt seismic shift in Asian market, October 27, 2017, https://asia.nikkei.com/Politics-Economy/Economy/Rising-US-energy-exports-could-prompt-seismic-shift-in-Asian-market?page=1

[ix]JWN Energy, US LNG exports to China to surge, October 12, 2017, http://www.jwnenergy.com/article/2017/10/us-lng-exports-china-surge/

[x] Gulf Times, U.S. gas traders want to know about LNG exports, October 1, 2017, http://www.gulf-times.com/story/565728/Forget-weather-US-gas-traders-want-to-know-about-L

[xi] Global Trade, US Coal and LNG Exports to China Surge, October 11, 2017, http://www.globaltrademag.com/global-trade-daily/us-coal-lng-exports-china-surge

[xii] Global Trade, Initial Results of the US-China 100-Day Economic Action Plan Released, May 12, 2017, http://www.globaltrademag.com/global-logistics/initial-results-us-china-100-day-economic-action-plan-released

[xiii] Asian Review, East Asia needs $80bn in infrastructure to meet LNG demand, September 28, 2017, https://asia.nikkei.com/Politics-Economy/Economy/East-Asia-needs-80bn-in-infrastructure-to-meet-LNG-demand

[xiv] Platts, Japan offers $10 billion to support Asian LNG growth, October 18, 2017, https://www.platts.com/latest-news/natural-gas/singapore/japan-offers-10-billion-to-support-asian-lng-26823387

The post U.S. to Become a Major LNG Exporter appeared first on IER.

Monday, October 30, 2017

NABCEP now available worldwide!

Attention international alumni! SEI is excited to announce that NABCEP certification just got more accessible. On October 17, The North American Board of Certified Energy Practitioners announced that for the first time NABCEP’s Photovoltaic (PV) Associate exam will be administered outside of North America. According to a press release on NABCEP’s website, the international exam will be the same one that is offered in North America, in a computerized format, and in English only.

NABCEP’s executive director, Shawn O’Brien, also released the following statement in the press release: “Candidates for NABCEP’s PV Associate exam live all over the globe, but until now they had to travel to either the U.S. or Canada to take the exam,” he said. “International administrations of NABCEP’s PV Associate exam will be offered at any of the international test sites of our testing vendor, Castle Worldwide, Inc.”

According to NABCEP, the PV Associate exam will be available in over 370 cities in 97 countries across the globe, including China, India, Australia, Germany, and Kenya. There will be an additional $75 fee for international students, which is a standard of Castle Worldwide, Inc. exams.

As an international solar energy training organization with student alumni in 145 countries, Solar Energy International (SEI) is excited to share this news with our worldwide network. The following is a statement from SEI’s Kristopher Sutton, Director of Business Development – Middle East and Africa.

“The ability to offer NABCEP’s PVA exam internationally is a huge development for SEI,” Kris said.  “Our Middle East program is rapidly growing in tandem with the markets in the region. Utilities and governments in the MENA region are working to develop standards that ensure safe, quality PV installations and for many years our students have been hearing about NABCEP and asking about access to their exams. Now, by offering the exam internationally we have an option to better serve our students and support the development of strong solar market around the world.”

Are you interested in NABCEP certification or sitting for the NABCEP exam? Solar energy training at SEI is a great place to start! Get started in the solar industry today with our free course RE100: Introduction to Renewable Energy or our course on the basics of solar PV training, PVOL101: Solar Training-Solar Electric Design and Installation.

The post NABCEP now available worldwide! appeared first on Solar Training - Solar Installer Training - Solar PV Installation Training - Solar Energy Courses - Renewable Energy Education - NABCEP - Solar Energy International (SEI).

Friday, October 27, 2017

How to Use the "Keywords by Site" Data in Tools (Moz, SEMrush, Ahrefs, etc.) to Improve Your Keyword Research and Targeting - Whiteboard Friday

Posted by randfish

One of the most helpful functions of modern-day SEO software is the idea of a "keyword universe," a database of tens of millions of keywords that you can tap into and discover what your site is ranking for. Rankings data like this can be powerful, and having that kind of power at your fingertips can be intimidating. In today's Whiteboard Friday, Rand explains the concept of the "keyword universe" and shares his most useful tips to take advantage of this data in the most popular SEO tools.

How to use keywords by site

Click on the whiteboard image above to open a high-resolution version in a new tab!


Video Transcription

Howdy, Moz fans, and welcome to another edition of Whiteboard Friday. This week we're going to chat about the Keywords by Site feature that exists now in Moz's toolset — we just launched it this week — and SEMrush and Ahrefs, who have had it for a little while, and there are some other tools out there that also do it, so places like KeyCompete and SpyFu and others.

In SEO software, there are two types of rankings data:

A) Keywords you've specifically chosen to track over time

Basically, the way you can think of this is, in SEO software, there are two kinds of keyword rankings data. There are keywords that you have specifically selected or your marketing manager or your SEO has specifically selected to track over time. So I've said I want to track X, Y and Z. I want to see how they rank in Google's results, maybe in a particular location or a particular country. I want to see the position, and I want to see the change over time. Great, that's your set that you've constructed and built and chosen.

B) A keyword "universe" that gives wide coverage of tens of millions of keywords

But then there's what's called a keyword universe, an entire universe of keywords that's maintained by a tool provider. So SEMrush has their particular database, their universe of keywords for a bunch of different languages, and Ahrefs has their keyword universe of keywords that each of those two companies have selected. Moz now has its keyword universe, a universe of, I think in our case, about 40 million keywords in English in the US that we track every two weeks, so we'll basically get rankings updates. SEMrush tracks their keywords monthly. I think Ahrefs also does monthly.

Depending on the degree of change, you might care or not care about the various updates. Usually, for keywords you've specifically chosen, it's every week. But in these cases, because it's tens of millions or hundreds of millions of keywords, they're usually tracking them weekly or monthly.

So in this universe of keywords, you might only rank for some of them. It's not ones you've specifically selected. It's ones the tool provider has said, "Hey, this is a broad representation of all the keywords that we could find that have some real search volume that people might be interested in who's ranking in Google, and we're going track this giant database." So you might see some of these your site ranks for. In this case, seven of these keywords your site ranks for, four of them your competitors rank for, and two of them both you and your competitors rank for.

Remarkable data can be extracted from a "keyword universe"

There's a bunch of cool data, very, very cool data that can be extracted from a keyword universe. Most of these tools that I mentioned do this.

Number of ranking keywords over time

So they'll show you how many keywords a given site ranks for over time. So you can see, oh, Moz.com is growing its presence in the keyword universe, or it's shrinking. Maybe it's ranking for fewer keywords this month than it was last month, which might be a telltale sign of something going wrong or poorly.

Degree of rankings overlap

You can see the degree of overlap between several websites' keyword rankings. So, for example, I can see here that Moz and Search Engine Land overlap here with all these keywords. In fact, in the Keywords by Site tool inside Moz and in SEMrush, you can see what those numbers look like. I think Moz actually visualizes it with a Venn diagram. Here's Distilled.net. They're a smaller website. They have less content. So it's no surprise that they overlap with both. There's some overlap with all three. I could see keywords that all three of them rank for, and I could see ones that only Distilled.net ranks for.

Estimated traffic from organic search

You can also grab estimated traffic. So you would be able to extract out — Moz does not offer this, but SEMrush does — you could see, given a keyword list and ranking positions and an estimated volume and estimated click-through rate, you could say we're going to guess, we're going to estimate that this site gets this much traffic from search. You can see lots of folks doing this and showing, "Hey, it looks this site is growing its visits from search and this site is not." SISTRIX does this in Europe really nicely, and they have some great blog posts about it.

Most prominent sites for a given set of keywords

You can also extract out the most prominent sites given a set of keywords. So if you say, "Hey, here are a thousand keywords. Tell me who shows up most in this thousand-keyword set around the world of vegetarian recipes." The tool could extract out, "Okay, here's the small segment. Here's the galaxy of vegetarian recipe keywords in our giant keyword universe, and this is the set of sites that are most prominent in that particular vertical, in that little galaxy."

Recommended applications for SEOs and marketers

So some recommended applications, things that I think every SEO should probably be doing with this data. There are many, many more. I'm sure we can talk about them in the comments.

1. Identify important keywords by seeing what you rank for in the keyword universe

First and foremost, identify keywords that you probably should be tracking, that should be part of your reporting. It will make you look good, and it will also help you keep tabs on important keywords where if you lost rankings for them, you might cost yourself a lot of traffic.

Monthly granularity might not be good enough. You might want to say, "Hey, no, I want to track these keywords every week. I want to get reporting on them. I want to see which page is ranking. I want to see how I rank by geo. So I'm going to include them in my specific rank tracking features." You can do that in the Moz Keywords by Site, you'd go to Keyword Explorer, you'd select the root domain instead of the keyword, and you'd plug in your website, which maybe is Indie Hackers, a site that I've been reading a lot of lately and I like a lot.

You could see, "Oh, cool. I'm not tracking stock trading bot or ark servers, but those actually get some nice traffic. In this case, I'm ranking number 12. That's real close to page one. If I put in a little more effort on my ark servers page, maybe I could be on page one and I could be getting some of that sweet traffic, 4,000 to 6,000 searches a month. That's really significant." So great way to find additional keywords you should be adding to your tracking.

2. Discover potential keywords targets that your competitors rank for (but you don't)

Second, you can discover some new potential keyword targets when you're doing keyword research based on the queries your competition ranks for that you don't. So, in this case, I might plug in "First Round." First Round Capital has a great content play that they've been doing for many years. Indie Hackers might say, "Gosh, there's a lot of stuff that startups and tech founders are interested in that First Round writes about. Let me see what keywords they're ranking for that I'm not ranking for."

So you plug in those two to Moz's tool or other tools. You could see, "Aha, I'm right. Look at that. They're ranking for about 4,500 more keywords than I am." Then I could go get that full list, and I could sort it by volume and by difficulty. Then I could choose, okay, these keywords all look good, check, check, check. Add them to my list in Keyword Explorer or Excel or Google Docs if you're using those and go to work.

3. Explore keywords sets from large, content-focused media sites with similar audiences

Then the third one is you can explore keyword sets. I'm going to urge you to. I don't think this is something that many people do, but I think that it really should be, which is to look outside of your little galaxy of yourself and your competitors, direct competitors, to large content players that serve your audience.

So in this case, I might say, "Gosh, I'm Indie Hackers. I'm really competing maybe more directly with First Round. But you know what? HBR, Harvard Business Review, writes about a lot of stuff that my audience reads. I see people on Twitter that are in my audience share it a lot. I see people in our forums discussing it and linking out to their articles. Let me go see what they are doing in the content world."

In fact, when you look at the Venn diagram, which I just did in the Keywords by Site tool, I can see, "Oh my god, look there's almost no overlap, and there's this huge opportunity." So I might take HBR and I might click to see all their keywords and then start looking through and sort, again, probably by volume and maybe with a difficulty filter and say, "Which ones do I think I could create content around? Which ones do they have really old content that they haven't updated since 2010 or 2011?" Those types of content opportunities can be a golden chance for you to find an audience that is likely to be the right types of customers for your business. That's a pretty exciting thing.

So, in addition to these, there's a ton of other uses. I'm sure over the next few months we'll be talking more about them here on Whiteboard Friday and here on the Moz blog. But for now, I would love to hear your uses for tools like SEMrush and the Ahrefs keyword universe feature and Moz's keyword universe feature, which is called Keywords by Site. Hopefully, we'll see you again next week for another edition of Whiteboard Friday. Take care.

Video transcription by Speechpad.com


Sign up for The Moz Top 10, a semimonthly mailer updating you on the top ten hottest pieces of SEO news, tips, and rad links uncovered by the Moz team. Think of it as your exclusive digest of stuff you don't have time to hunt down but want to read!

Thursday, October 26, 2017

A Final Word on Vox and Oil Change International: The Myth of Lost Royalties

Let’s break down this idea of lost royalties and revenue.

The Oil Change International study that we’ve commented on here and here this week cites two very large numbers for supposedly lost federal revenues: royalties from deep-water drilling and from low-cost leasing in the Powder River Basin. Together these categories add over $2.1 billion to subsidy figure OCI reports.

But wait a minute, how does OCI know that those revenues were “lost”? What is the “correct” royalty rate or development cost for minerals on federal land? There is no market for these rates; the federal government arbitrarily sets them. To call a given royalty rate “low” is entirely subjective, it is in the opinion of whoever writes up the estimate.

Many commentators, like the authors of this report, seek to compare federal royalty rates to rates on state and private land, but that is an apples to oranges comparison. State and private royalty rates are highly variable, depending on all sorts of conditions. The report specifically mentions the minimum oil royalty rate in Texas, which is 20%. But Texas has a very streamlined permitting system, a state government that is knowledgeable about energy and pro-development, a clear legal regime for energy development and well-proven reserves. All these factors substantially reduce the risk of a given well, meaning that a company may be perfectly happy to pay that higher royalty rate. On federal lands there is often substantially more risk. For example: a capricious administration might choose to jack up royalties; permitting delays from hostile bureaucrats raise costs; federal lands are often well removed from pipeline infrastructure as well as refining markets requiring greater transportation outlays; environmental regulations of all kinds can slow or potentially stop exploration and production at any time; the constant threat of litigation from anti-development special interests hangs over any project; and to top it off, federal subsurface resources are often less carefully mapped, so it is less certain what will actually be found. With all these additional risks, perhaps this “low” royalty rate is actually the correct level needed to compensate.

But the sophistry of the report is put in even starker relief when looking at the details. Under the category of “lost royalties on deep-water drilling,” the largest component is a little over $1 billion “lost” on leases issued from 1996-2000. For those old enough to remember (which may not include many Vox readers) that was a period of very low oil prices. Indeed, adjusted for inflation, the annual average oil price reached a record low for the second half of the 20th century in 1998. In that price environment, those wells may not have even been drilled, which would have resulted in no potential revenues of any kind. So it is a bit rich to claim that revenues were “lost” when in the alternative scenario they would not have existed at all.

The report uses similar obfuscation to claim that coal mining in the Powder River Basin benefits from just under $1 billion in “subsidies.” But this number again is entirely arbitrary, based on another anti-fossil fuel organization’s own interpretation of federal law combined with some arbitrary economic calculations. Whatever the merits of this assertion (which have not been endorsed by the courts), disagreement about the correct application of federal law is not anyone’s definition of a “subsidy.” Furthermore, the assertion that leasing in the Powder River Basin is offered for below market value suffers from the same fallacy discussed above, what is fair market value? Given all the risks involved in developing coal on federal land (as the constant nuisance lawsuits from anti-development groups attest to), fair market value is subjective. The Bureau of Land Management calculates minimum bids that it believes reflect fair market value, and if a coal company surpasses that minimum, its gets the lease. That in the opinion of the report’s authors fair market value should be higher does not suddenly prove the existence of “subsidies.”

And keep in mind that revenue from coal mining and oil and gas activity is far more than just royalties. Companies must bid on the leases in the first place, the companies pay taxes on their profits, the companies employ (well-paid) individuals who pay taxes, the various contractors and suppliers to these companies all pay taxes and so on down the line. In the absence of coal mining or oil and gas drilling, all that revenue and economic activity goes away. And that is without even considering intangible benefits that domestic energy production provides by reducing imports as well as the lower energy costs that abundant domestic production brings to the entire economy.

Conclusion: The Usual Dishonesty

Ultimately, though, what this report is about, and why anti-development organizations and their fellow travelers in the media cite it so enthusiastically, is preventing energy development. This has been the animating force behind the environmental left for decades now. They have failed to persuade the public of their global warming religion, so they grasp for this false equivalency, attempting to convince the public that the government handouts and mandates for their ideologically preferred renewables are nothing compared to the supposed subsidies for coal, oil and natural gas.

Vox and Oil Change International don’t have any real economic argument to support their obsessive promotion of wind and solar, so they are reduced to deception. Anything to avoid acknowledging the truth: affordable, abundant energy derived from fossil fuels has been, and continues to be, the greatest boon to the welfare of mankind in its history.

The post A Final Word on Vox and Oil Change International: The Myth of Lost Royalties appeared first on IER.

Invest in a future powered by renewable energy with the Clean Energy Credit Union

Have you ever wondered how you can support the clean energy movement? Clean Energy Credit Union presents a new, exciting opportunity to join the fight against climate change, protect the environment, and invest in sustainable practices.

Clean Energy Credit Union is a member-owned, member-governed financial institution with a unique twist: it is focused exclusively on loans that help people fund clean energy projects such as solar electric systems, electric vehicles, home energy efficiency retrofits, electric-assist bicycles, and more.

A group of clean energy enthusiasts came together to develop the Clean Energy Credit Union. According to Amanda Bybee, one of the primary organizers, the official process to form the lending institution started back in 2014.

“The motivation was to create a financing mechanism for homeowners that felt more transparent, that had competitive terms, and that would harness the power of the world at large to support clean energy in an innovative way,” Amanda explained.

Clean Energy Credit Union is one of just 17 new federal charters that has been approved since 2017, and the first one based in Colorado in over 30 years. However, anyone in the U.S. with a membership to the American Solar Energy Society (ASES) can join and make use of the financial services.

“We will operate entirely online, so that the operational overhead of Clean Energy Credit Union is really lean, and then we can put that back into low interest rates on our loans,” Amanda explained. Clean Energy Credit Union is federally insured, which presents a low-risk investment opportunity for members.

Individuals interested in supporting this unique, grassroots movement to make clean energy investments more accessible can participate in two ways:

  1. Donate online today to the crowdfunding campaign. A donation of $40 includes a one-year membership to ASES, a requirement for joining Clean Energy Credit Union.
  2. Become a member by the end of the year, when it opens for business, with a savings account or a CD.

“Our hope that this becomes a mechanism to accelerate the adoption of clean energy and enable everyone to participate in the clean energy movement. We believe that the interest is out there for people to put their money in places that are meaningful,” Amanda explained, “It’s just about getting the word out to them.”

You, too, can spread the word about this innovative investment opportunity by sharing the website and crowdfunding page with your friends, family, and network today.

The post Invest in a future powered by renewable energy with the Clean Energy Credit Union appeared first on Solar Training - Solar Installer Training - Solar PV Installation Training - Solar Energy Courses - Renewable Energy Education - NABCEP - Solar Energy International (SEI).

Wednesday, October 25, 2017

How to Do a Competitor Analysis for SEO

Posted by John.Reinesch

Competitive analysis is a key aspect when in the beginning stages of an SEO campaign. Far too often, I see organizations skip this important step and get right into keyword mapping, optimizing content, or link building. But understanding who our competitors are and seeing where they stand can lead to a far more comprehensive understanding of what our goals should be and reveal gaps or blind spots.

By the end of this analysis, you will understand who is winning organic visibility in the industry, what keywords are valuable, and which backlink strategies are working best, all of which can then be utilized to gain and grow your own site’s organic traffic.

Why competitive analysis is important

SEO competitive analysis is critical because it gives data about which tactics are working in the industry we are in and what we will need to do to start improving our keyword rankings. The insights gained from this analysis help us understand which tasks we should prioritize and it shapes the way we build out our campaigns. By seeing where our competitors are strongest and weakest, we can determine how difficult it will be to outperform them and the amount of resources that it will take to do so.

Identify your competitors

The first step in this process is determining who are the top four competitors that we want to use for this analysis. I like to use a mixture of direct business competitors (typically provided by my clients) and online search competitors, which can differ from whom a business identifies as their main competitors. Usually, this discrepancy is due to local business competitors versus those who are paying for online search ads. While your client may be concerned about the similar business down the street, their actual online competitor may be a business from a neighboring town or another state.

To find search competitors, I simply enter my own domain name into SEMrush, scroll down to the “Organic Competitors” section, and click “View Full Report.”

The main metrics I use to help me choose competitors are common keywords and total traffic. Once I've chosen my competitors for analysis, I open up the Google Sheets Competitor Analysis Template to the “Audit Data” tab and fill in the names and URLs of my competitors in rows 2 and 3.

Use the Google Sheets Competitor Analysis Template

A clear, defined process is critical not only for getting repeated results, but to scale efforts as you start doing this for multiple clients. We created our Competitor Analysis Template so that we can follow a strategic process and focus more on analyzing the results rather than figuring out what to look for anew each time.

In the Google Sheets Template, I've provided you with the data points that we'll be collecting, the tools you'll need to do so, and then bucketed the metrics based on similar themes. The data we're trying to collect relates to SEO metrics like domain authority, how much traffic the competition is getting, which keywords are driving that traffic, and the depth of competitors’ backlink profiles. I have built in a few heatmaps for key metrics to help you visualize who's the strongest at a glance.

This template is meant to serve as a base that you can alter depending on your client’s specific needs and which metrics you feel are the most actionable or relevant.

Backlink gap analysis

A backlink gap analysis aims to tell us which websites are linking to our competitors, but not to us. This is vital data because it allows us to close the gap between our competitors’ backlink profiles and start boosting our own ranking authority by getting links from websites that already link to competitors. Websites that link to multiple competitors (especially when it is more than three competitors) have a much higher success rate for us when we start reaching out to them and creating content for guest posts.

In order to generate this report, you need to head over to the Moz Open Site Explorer tool and input the first competitor’s domain name. Next, click “Linking Domains” on the left side navigation and then click “Request CSV” to get the needed data.

Next, head to the SEO Competitor Analysis Template, select the “Backlink Import - Competitor 1” tab, and paste in the content of the CSV file. It should look like this:

Repeat this process for competitors 2–4 and then for your own website in the corresponding tabs marked in red.

Once you have all your data in the correct import tabs, the “Backlink Gap Analysis” report tab will populate. The result is a highly actionable report that shows where your competitors are getting their backlinks from, which ones they share in common, and which ones you don’t currently have.

It’s also a good practice to hide all of the “Import” tabs marked in red after you paste the data into them, so the final report has a cleaner look. To do this, just right-click on the tabs and select “Hide Sheet,” so the report only shows the tabs marked in blue and green.

For our clients, we typically gain a few backlinks at the beginning of an SEO campaign just from this data alone. It also serves as a long-term guide for link building in the months to come as getting links from high-authority sites takes time and resources. The main benefit is that we have a starting point full of low-hanging fruit from which to base our initial outreach.

Keyword gap analysis

Keyword gap analysis is the process of determining which keywords your competitors rank well for that your own website does not. From there, we reverse-engineer why the competition is ranking well and then look at how we can also rank for those keywords. Often, it could be reworking metadata, adjusting site architecture, revamping an existing piece of content, creating a brand-new piece of content specific to a theme of keywords, or building links to your content containing these desirable keywords.

To create this report, a similar process as the backlink gap analysis one is followed; only the data source changes. Go to SEMrush again and input your first competitor’s domain name. Then, click on the “Organic Research” positions report in the left-side navigation menu and click on "Export" on the right.

Once you download the CSV file, paste the content into the “Keyword Import - Competitor 1” tab and then repeat the process for competitors 2–4 and your own website.

The final report will now populate on the “Keyword Gap Analysis” tab marked in green. It should look like the one below:

This data gives us a starting point to build out complex keyword mapping strategy documents that set the tone for our client campaigns. Rather than just starting keyword research by guessing what we think is relevant, we have hundreds of keywords to start with that we know are relevant to the industry. Our keyword research process then aims to dive deeper into these topics to determine the type of content needed to rank well.

This report also helps drive our editorial calendar, since we often find keywords and topics where we need to create new content to compete with our competitors. We take this a step further during our content planning process, analyzing the content the competitors have created that is already ranking well and using that as a base to figure out how we can do it better. We try to take some of the best ideas from all of the competitors ranking well to then make a more complete resource on the topic.

Using key insights from the audit to drive your SEO strategy

It is critically important to not just create this report, but also to start taking action based on the data that you have collected. On the first tab of the spreadsheet template, we write in insights from our analysis and then use those insights to drive our campaign strategy.

Some examples of typical insights from this document would be the average number of referring domains that our competitors have and how that relates to our own backlink profile. If we are ahead of our competitors regarding backlinks, content creation might be the focal point of the campaign. If we are behind our competitors in regards to backlinks, we know that we need to start a link building campaign as soon as possible.

Another insight we gain is which competitors are most aggressive in PPC and which keywords they are bidding on. Often, the keywords that they are bidding on have high commercial intent and would be great keywords to target organically and provide a lift to our conversions.

Start implementing competitive analyses into your workflow

Competitive analyses for SEO are not something that should be overlooked when planning a digital marketing strategy. This process can help you strategically build unique and complex SEO campaigns based on readily available data and the demand of your market. This analysis will instantly put you ahead of competitors who are following cookie-cutter SEO programs and not diving deep into their industry. Start implementing this process as soon as you can and adjust it based on what is important to your own business or client’s business.

Don’t forget to make a copy of the spreadsheet template here:

Get the Competitive Analysis Template


Sign up for The Moz Top 10, a semimonthly mailer updating you on the top ten hottest pieces of SEO news, tips, and rad links uncovered by the Moz team. Think of it as your exclusive digest of stuff you don't have time to hunt down but want to read!

More on Vox and Oil Change International

Yesterday IER clearly and methodically broke down the major components of the recent report from Oil Change International, highly touted on the left and in the media, which purports to show vast subsidies for fossil fuels in the United States (the implication being that they are far greater than the well known subsidies and mandates which prop up their favor technologies such as wind and solar). That previous post shows how this report is out of line with more authoritative, and non-biased, data from the Energy Information Administration and the Congressional Research Service, but in this post let’s take a closer look at the justification for including the data categories that the OCI study selects to paint as subsidies, many of which rely on a very ideological construction of the term subsidy.

Tax Provisions That Apply to Every Company Are “Subsidies”

Three of the top 10 largest “subsidies” identified by OCI are in fact generally applicable elements of the tax code available to all companies in the United States, including companies more favored in OCI’s eyes. Last-in, first-out accounting, the domestic manufacturing deduction, and the dual capacity taxpayer deduction, cannot be considered fossil fuel subsidies by any honest observer. If everyone gets the same subsidy then it is no longer a “subsidy” in any real sense, it is just the tax code. It would be the same as claiming that fossil fuel companies receive a “subsidy” because they have the same statutory 35% tax rate as every other company instead of a 50% or 100% rate. This is of course preposterous, and adds nothing to the discussion other than to dishonestly bump up the total dollar figure to a more impressive number. This dishonesty adds over $3 billion to OCI’s total.

The Old Standbys

Two of the advertised subsidies are old chestnuts that the environmental left has been harping on for decades: the deduction for intangible drilling costs and the expensing of percentage cost over depletion. The intangible drilling costs deduction is similar to the deduction other businesses receive for investments like R&D and expensing over depletion is analogous to depreciation expensing in other industries. Note these two tax provisions apply in only limited fashion and not at all, respectively, when it comes to large oil companies. These are not the subsidies for big oil companies of the left’s imagination. These two provisions, amounting to $3.8 billion of OCI’s total, have been endlessly debated elsewhere, so there is little to add here. Suffice it to say that the energy industry contends that these are the industry’s versions of provisions that are generally applicable, while OCI and the left disagree.

Conclusion

Whenever a report is released that is funded by the oil and gas industry, the left immediately dismisses it as biased because the funder has an interest in the outcome. Well what is this report? It is created by an organization dedicated to eliminating the use of fossil fuels. How is their report any less biased? Far from exposing hypocrisy in the oil and gas industry, that this report from OCI is accepted and reported uncritically serves more to expose the weakness of the arguments underlying the anti-development left.

Tomorrow I’ll take you deeper into the OCI study’s obfuscation as it pertains to supposed “lost” royalties and revenues.

The post More on Vox and Oil Change International appeared first on IER.

Tuesday, October 24, 2017

Tangential Content Earns More Links and Social Shares in Boring Industries [New Research]

Posted by kerryjones

Many companies still don’t see the benefit of creating content that isn’t directly about their products or brand. But unless you have a universally interesting brand, you’ll be hard-pressed to attract much of an audience if all you do is publish brand-centric content.

Content marketing is meant to solve this dilemma. By offering genuinely useful content to your target customers, rather than selling to them, you earn their attention and over time gain their trust.

And yet, I find myself explaining the value of non-branded content all too often. I frequently hear grumblings from fellow marketers that clients and bosses refuse to stray from sales-focused content. I see companies publishing what are essentially advertorials and calling it content marketing.

In addition to turning off customers, branded content can be extremely challenging for building links or earning PR mentions. If you’ve ever done outreach for branded content, you’ve probably gotten a lot of pushback from the editors and writers you’ve pitched. Why? Most publishers bristle at content that feels like a brand endorsement pretending not to be a brand endorsement (and expect you to pay big bucks for a sponsored content or native advertising spot).

Fortunately, there’s a type of content that can earn your target customers’ attention, build high-quality links, and increase brand awareness...

Tangential content: The cure for a boring niche

At Fractl, we refer to content on a topic that’s related to (but not directly about) the brand that created it as "tangential content."

Some hypothetical examples of tangential content would be:

  • A pool installation company creating content about summer safety tips and barbeque recipes.
  • A luggage retailer publishing country-specific travel guides.
  • An auto insurance broker offering car maintenance advice.

While there’s a time for branded content further down the sales funnel, tangential content might be right for you if you want to:

  1. Reach a wide audience and gain top-of-funnel awareness. Not a lot of raving fans in your “boring” brand niche? Tangential topics can get you in front of the masses.
  2. Target a greater number of publishers during outreach to increase your link building and PR mention potential. Tangential topics work well for outreach because you can expand your pool of publishers (larger niches vs. a small niche with only a few dedicated sites).
  3. Create more emotional content that resonates with your audience. In an analysis of more than 300 client campaigns, we found the content that received more than 200 media mentions was more likely than low-performing campaigns to have a strong emotional hook. If your brand niche doesn’t naturally tug on the heartstrings, tangential content is one way to create an emotional reaction.
  4. Build a more diverse content library and not be limited to creating content around one topic. If you’ve maxed out on publishing content about your niche, broadening your content repertoire to tangential topics can reinvigorate your content strategy (and your motivation).

Comparison of tangential vs. on-brand content performance

In our experience at Fractl, tangential content has been highly effective for link building campaigns, especially in narrow client niches that lack broad appeal. While we’ve assumed this is true based on our observations, we now have the data to back up our assumption.

We recently categorized 835 Fractl client campaigns as either “tangential” or “on-brand,” then compared the average number of pickups (links and press mentions) and number of social shares for each group. Our hunch was right: The tangential campaigns earned 30% more media mentions and 77% more social shares on average than the brand-focused campaigns.

So what exactly does a tangential campaign look like? Below are some real examples of our client campaigns that illustrate how tangential topics can yield stellar results.

Most Hateful/Most Politically Correct Places

  • Client niche: Apartment listing site
  • Campaign topic: Which states and cities use the most prejudiced/racist language based on geo-tagged Twitter data
  • Results: 67,000+ social shares and 620 media pickups, including features on CNET, Slate, Business Insider, AOL, Yahoo, Mic, The Daily Beast, and Adweek

Why it worked

After a string of on-brand campaigns for this client yielded average results, we knew capitalizing on a hot-button, current issue would attract tons of attention. This topic still ties back into the client’s main objective of helping people find a home since the community and location of that home are important factors in one’s decisions. Check out the full case study of this campaign for more insights into why it was successful.

Most Instagrammed Locations

  • Client niche: Bus fare comparison and booking tool
  • Campaign topic: Points of interest where people post the most Instagram photos in North America
  • Results: 40,000+ social shares and more than 300 pickups, including TIME, NBC News, Business Insider, Today, Yahoo!, AOL, Fast Company, and The Daily Mail

Why it worked

Our client’s niche, bus travel, had a limited audience, so we chose a topic that was of interest to anyone who enjoys traveling, regardless of the mode of transportation they use to get there. By incorporating data from a popular social network and using an idea with a strong geographic focus, we could target a lot of different groups — the campaign appealed to travel enthusiasts, Instagram users, and regional and city news outlets (including TV stations). For more details about our thought process behind this idea, see the campaign case study.

Most Attractive NFL Players and Teams

whitney-mercilus.png

Client niche: Sports apparel retailer

Campaign topic: Survey that rates the most attractive NFL players

Results: 45,000+ social shares and 247 media pickups, including CBS Sports, USA Today, Fox Sports, and NFL.com

Why it worked

Since diehard fans want to show off that their favorite player is the best, even if it’s just in the looks department, we were confident this lighthearted campaign would pique fan interest. But fans weren’t the only ones hitting the share button — the campaign also grabbed the attention of the featured teams and players, with many sharing on their social media profiles, which helped drive exposure.

On-brand content works best in certain verticals

Tangential content isn’t always necessary for earning top-of-funnel awareness. So, how do you know if your brand-centric topics will garner lots of interest? A few things to consider:

  • Is your brand topic interesting or useful to the general population?
  • Are there multiple publishers that specifically cover your niche? Do these publishers have large readerships?
  • Are you already publishing on-brand content that is achieving your goals/expectations?

We’ve seen several industry verticals perform very well using branded content. When we broke down our campaign data by vertical, we found our top performing on-brand campaign topics were technology, drugs and alcohol, and marketing.

Some examples of our successful on-brand campaign topics include:

  • “Growth of SaaS” for a B2B software comparison website
  • “Influencers on Instagram” for an influencer marketplace
  • “Global Drug Treatment Trends” for an addiction recovery client
  • “The Tech Job Network” for a tech career website

Coming up with tangential content ideas

Once you free yourself from only brainstorming brand-centric ideas, you might find it easy to dream up tangential concepts. If you need a little help, here are a few tips to get you started:

Review your buyer personas.

In order to know which tangential topics to choose, you need to understand your target audience’s interests and where your niche intersects with those interests. The best way to find this information? Buyer personas. If you don’t already have detailed buyer personas built out, Mike King’s epic Moz post from a few years ago remains the bible on personas in my opinion.

Find topics your audience cares about with Facebook Audience Insights.

Using its arsenal of user data, this Facebook ads tool gives you a peek into the interests and lifestyles of your target audience. These insights can supplement and inform your buyer personas. See the incredibly actionable post “How to Create Buyer Personas on a Budget Using Facebook Audience Insights” for more help with leveraging this tool.

Consider how trending news topics are tangential to your brand.

Pay attention to themes that keep popping up in the news and how your brand relates back to these stories (this is how the most racist/bigoted states and cities campaign I mentioned earlier in this post came to be). Also anticipate seasonal or event-based topics that are tangential to your brand. For example, a tire manufacturer may want to create content on protecting your car from flooding and storm damage during hurricane season.

Test tangential concepts on social media.

Not sure if a tangential topic will go over well? Before moving forward with a big content initiative, test it out by sharing content related to the topic on your brand’s social media accounts. Does it get a good reaction? Pro tip: spend a little bit of money promoting these as sponsored posts to ensure they get in front of your followers.

Have you had success creating content outside of your brand niche? I’d love to hear about your tangential content examples and the results you achieved, please share in the comments!


Sign up for The Moz Top 10, a semimonthly mailer updating you on the top ten hottest pieces of SEO news, tips, and rad links uncovered by the Moz team. Think of it as your exclusive digest of stuff you don't have time to hunt down but want to read!

Vox and Oil Change International Misconstrue Subsidy Landscape

A recent article published by Vox leads readers to believe that subsidies for oil, coal and natural gas outweigh those for renewable energy.[i] The article is based on a study from Oil Change International, titled “Dirty Energy Dominance: Dependent on Denial: How the U.S. Fossil Fuel Industry Depends on Subsidies and Climate Denial.”[ii]

The Oil Change International study quotes fossil fuel production subsidies (an average of 2015 and 2016) of $20.5 billion, of which $14.87 billion are for federal subsidies and the remainder ($5.8 billion) are for state-level incentives. The Energy Information Administration (EIA) and the Congressional Research Service (CRS) find federal fossil fuel subsidies to be much lower. EIA finds federal fossil fuel subsidies for fiscal year 2013 to be $3.33 billion (in 2013 dollars) and the CRS calculates federal fossil fuel tax provisions, a subsidy component, in 2016 at $5.2 billion. Neither organization provides an estimate of state-level subsidies.

As shown below, the Oil Change International numbers are inflated by claiming items such as lost royalties for onshore/offshore oil drilling and low-cost leasing of coal in the Powder River Basin as subsidies when they are not.

Comparison of Fossil Fuel Subsidies and Renewable Subsidies

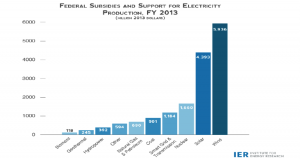
The Oil Change International study fails to provide an estimate of subsidies for other fuels such as wind and solar energy. However, the studies by EIA and CRS provide federal subsidies for those energy sources and find them to be much larger than federal fossil fuel subsidies. EIA finds federal renewable energy subsidies to be $15.053 billion—almost 5 times the federal fossil fuel subsidy level in 2013.[iii] EIA’s subsidy value includes direct expenditures, tax expenditures, research and development, the Department of Energy’s loan guarantee program and federal and RUS electricity. EIA also breaks down its subsidies by fuel type. The following graph compares EIA’s federal subsidies and financial incentives for electricity production by fuel type.


Source: EIA, https://www.eia.gov/analysis/requests/subsidy/pdf/subsidy.pdf

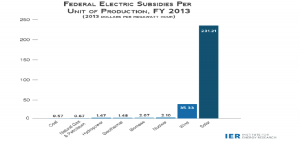
On a unit of production basis and when adjusting for the federal subsidies and interventions for electricity output, the disparity in federal support becomes even greater because wind and solar contributed only a small share of the total market. At $231 per megawatt hour, the federal support for solar in 2013 is about 400 times the federal support for coal.


Source: IER calculations based on data from EIA (2015). “Direct Federal Financial Interventions and Subsidies in Energy in Fiscal Year 2013.”

The CRS calculated 2016 tax provisions for renewable energy at $11.1 billion—over twice the fossil fuel value. By far the largest subsidies in the CRS analysis were the production tax credit for wind at $3.4 billion and the investment tax credit for solar at $2.6 billion. Their expected 2016 to 2020 value is $25.7 billion for the production tax credit and $13.6 billion for the investment tax credit. The largest fossil fuel tax provision, according to CRS, in 2016 was the expensing of intangible drilling costs at $1.8 billion. These costs are expected to reach $8 billion over the 2016 to 2020 period, far below the production tax credit for wind and the investment tax credit for solar. [iv]

The Oil Change International vs. CRS Tax Provisions for Fossil Fuels

The CRS provided actual tax provisions for fossil fuels for 2016 totaling $5.2 billion. The Oil Change International study provided estimates of tax provisions for 2015 and 2016 and an average of the two years. The table below compares the tax provisions of the Oil Change International study using its 2016 estimate to the CRS actual values for 2016. The Oil Change International tax provisions are 30 percent higher than those in the CRS study.

Comparison of Tax Provisions for Fossil Fuels—Oil Change International and CRS 2016 Estimate

(Billion $)

VOX

2016 Estimate

(Billion $)

CRS

Expensing of intangible drilling costs 2.267 1.8
Expensing of percentage over cost depletion 1.301 0.9
Amortization of G&G expenditures for oil & gas exploration 0.070  0.1
Credits for investing in clean coal facilities  0.160 0.2
Amortization of air and pollution control facilities 0.500 0.5
Exceptions for energy related publicly traded partnerships 2.473 0.9
Credits for alternative fuels and alternative fuels mixtures  0 0.8
Total 6.771 5.2

Subsidies in the Oil Change International Study

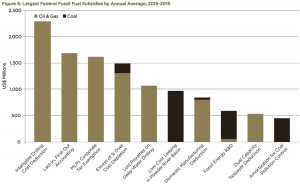
The Oil Change International study lists dozens of subsidies; the largest that they note are listed in the graph below. Note that last-in, first-out accounting, the domestic manufacturing credit and the dual capacity taxpayer deduction are allowed for all U.S. industries. Also note that lost royalties on deep water drilling and low-cost leasing in the Powder River Basin are not subsidies since they both follow the current U.S. law.

Source: https://www.vox.com/energy-and-environment/2017/10/6/16428458/us-energy-subsidies

Intangible Drilling Cost Deduction

Independent oil producers are allowed to count certain costs associated with the drilling and development of their wells as business expenses. The law allows small independent producers (fewer than 20 employees) to expense the full value of these costs to encourage them to produce oil from marginal wells that are old or small and do not produce much individually. According to the Independent Petroleum Association of America, independent producers drill 95 percent of the oil and natural gas wells in the United States. They develop 54 percent of the onshore oil and they hold 81 percent of the producing leases in the offshore Gulf of Mexico, accounting for 30 percent of the oil production there.[v] The major oil companies get a portion of this deduction—they can expense a third of intangible drilling costs, but they must spread the deductions across a five-year period. This tax treatment is similar to that of other businesses for such investments as research and development.

The Oil Change International estimate for expensing of intangible drilling costs in 2016 is about 25 percent higher than the CRS actual value. (See table above.)

Last-In, First-Out Accounting

All U.S. taxpayers may use the Last-In-First-Out (LIFO) method of accounting that allows companies to assume for accounting purposes the cost of the inventory most recently acquired to estimate taxable income.

Master Limited Partnerships Tax Exemption

The Master Limited Partnership Tax Exemption allows a tax exemption for energy-related publicly traded partnerships. The Oil Change International estimate for this tax deduction in 2016 is almost 3 times higher than in the CRS study for 2016.

Expensing of a Percentage Over Cost Depletion

As the oil and gas in a well is depleted, independent producers are allowed a percentage depletion allowance to be deducted from their taxes. The percentage depletion allowance is similar to the treatment given other businesses for depreciation of an asset. The tax code essentially treats the value of a well as it does the value of a newly constructed factory, allowing a percentage of the value to be depreciated each year. This allowance was first instituted in 1926 to compensate for the decreasing value of the resource, and was eliminated for major oil companies in 1975. This allowance applies only to the first 1,000 barrels of production during the period, so it is of little significance to large independent producers.

The Oil Change International estimate for this tax deduction is almost 50 percent higher than the CRS value.

Lost Royalties on Deep Water Drilling

The deep water royalty relief program originally provided royalty relief for operators to develop fields in water depths greater than 200 meters (656 feet). The suspension of federal royalty payments for new leases was limited to a certain level of production based on water depth. The original terms and conditions expired in November 2000, and since that time, a revised plan was adopted that is no longer based on volumes determined by water-depth intervals. Instead, the Department of Interior assigns a lease-specific volume of royalty suspension based on how the determined suspension amount may affect the economics of various development scenarios with the most economically risky projects receiving the most relief, while others may receive no relief. For example, a deep-water field might not receive any relief if it is adjacent to an existing gathering system. On the other hand, a similar field may receive a great deal of relief if it is located far beyond the current pipeline infrastructure. If the royalty relief program did not exist, the technology would not have been developed to produce oil and natural gas in the deep water Gulf of Mexico.[vi]

During the Clinton era, the Honorable Hazel O’Leary, Secretary of Energy defended the program. In a letter on page H11872 of the Congressional Record in support of the legislation, the Secretary said, “Comparing this loss (foregone royalties) with the gain from the bonus bids on a net present value basis, the federal government would be ahead by $200 million. It is important to note that affected OCS projects would still pay a substantial upfront bonus and then be required to pay a royalty when and if production exceeds their royalty-free period. A royalty-free period … would help enable marginally viable OCS projects to be developed, thus providing additional energy, jobs and other important benefits to the nation.”[vii]

The authors of the Oil Change International study assessed an additional $1.2 billion as lost royalties from deep water oil and gas production despite the current treatment described above.

Low Cost Leasing in the Powder River Basin

A royalty rate of 12.5 percent is obtained for coal mined by surface mining methods and 8 percent for coal mined by underground mining methods. Coal mined in the Powder River Basin is surface mined and pays the 12.5 percent fee—the same royalty fee that the oil and gas industry pays.[viii] The authors of the Oil Change International Study assessed a higher amount of $963 million as an additional subsidy despite the current law. President Trump’s Department of Interior is reevaluating royalty rates for all energy industries, including renewable energy, to see if Americans are getting a fair return for our natural resources.[ix]

Domestic Manufacturing Deduction

The purpose of the domestic manufacturing tax deduction is to incentivize companies to continue to do business in America. The United States now has the highest tax rate in the world among developed countries, and due to these high tax rates, companies have been making investments overseas. The domestic manufacturing tax deduction allows all industries and businesses (not just fossil fuel companies) to deduct a certain percentage of their profits. For fossil fuels industries, the tax deduction is 6 percent; for all other industries (software developers, video game developers, the motion picture industry, among others), it is a 9-percent deduction.

Dual Capacity Tax Payer Deduction

All U.S. taxpayers may use the dual capacity tax payer deduction if it is applicable. The United States taxes its citizens, residents and corporations on their worldwide incomes. Because the countries in which income is earned also may also tax the same income, foreign source income earned by U.S. persons may be subject to double taxation. To mitigate this possibility, the United States provides a credit against U.S. tax liability for foreign income taxes paid or accrued.[x]

Conclusion

There are numerous fossil fuel subsidies in the appendix of the Oil Change International report that many would agree are not subsidies since they are not based on current U.S. law. A few of those are mentioned above. The Oil Change International report did not compare its fossil fuel subsidies to those for renewable energy. But, as can be seen from the EIA and CRS analyses, subsidies and tax provisions for renewable energy are far greater than for fossil fuels.

IER supports broad-based tax reform that would eliminate targeted tax credits and deductions for all firms, but in the meantime, the tax code should treat coal, oil and natural gas producers the same as it treats the rest of U.S. businesses or manufacturers for performing comparable activities. Ultimately, government policies should not distort energy markets, and the tax code should not favor or disenfranchise particular sources for political ends.


[i] VOX, Friendly policies keep US oil and coal afloat far more than we thought, October 7, 2017, https://www.vox.com/energy-and-environment/2017/10/6/16428458/us-energy-subsidies

[ii] Oil Change International, Dirty Energy Dominance: Dependent on Denial, October 2017, http://priceofoil.org/content/uploads/2017/10/OCI_US-Fossil-Fuel-Subs-2015-16_Final_Oct2017.pdf

[iii] Energy Information Administration, Direct Federal Financial Interventions and Subsidies in Energy in Fiscal Year 2013, March 2015, https://www.eia.gov/analysis/requests/subsidy/pdf/subsidy.pdf

[iv] Congressional Research Service memorandum, Energy Tax Provisions, March 27, 2017, http://docs.house.gov/meetings/IF/IF03/20170329/105798/HHRG-115-IF03-20170329-SD002.pdf

[v] Declaration of Independents, http://oilindependents.org/about/

[vi] The Encyclopedia of Earth, The Deep Water Royalty Relief Act, https://editors.eol.org/eoearth/wiki/Deep_Water_Royalty_Relief_Act

[vii] Congressional Record, November 8, 1995, https://www.gpo.gov/fdsys/pkg/CREC-1995-11-08/pdf/CREC-1995-11-08.pdf

[viii] Bureau of Land Management, Frequently Asked Questions About the Federal Coal Leasing Program, https://eplanning.blm.gov/epl-front-office/projects/nepa/64842/78268/88489/CoalFAQ.pdf

[ix] Reuters, U.S. to review energy royalty rates on federal land, March 28, 2017, https://www.reuters.com/article/us-usa-interior-royalties/u-s-to-review-energy-royalty-rates-on-federal-land-idUSKBN1702KC?il=0

[x] Joint Committee on Taxation, Description of Current Law and Select Proposals Related to the Oil and Gas Industry, https://www.jct.gov/publications.html?func=startdown&id=3787

The post Vox and Oil Change International Misconstrue Subsidy Landscape appeared first on IER.