The International Energy Agency (IEA) recently released its Medium-Term Renewable Energy Market Report 2016 finding that renewable energy, particularly solar and wind, will be the fastest-growing source of electricity generating capacity over the next five years because of supportive government policies and expected cost reductions.[i] According to the IEA, renewables accounted for more than half of the world’s additional electricity capacity last year. But, what IEA fails to tell you is that renewable energy produces less electricity per unit of capacity than other forms of electricity generation such as coal, natural gas, or nuclear power. Thus, while government policies are supporting its growth in capacity other forms of generation are contributing far greater to powering the global electricity grid.
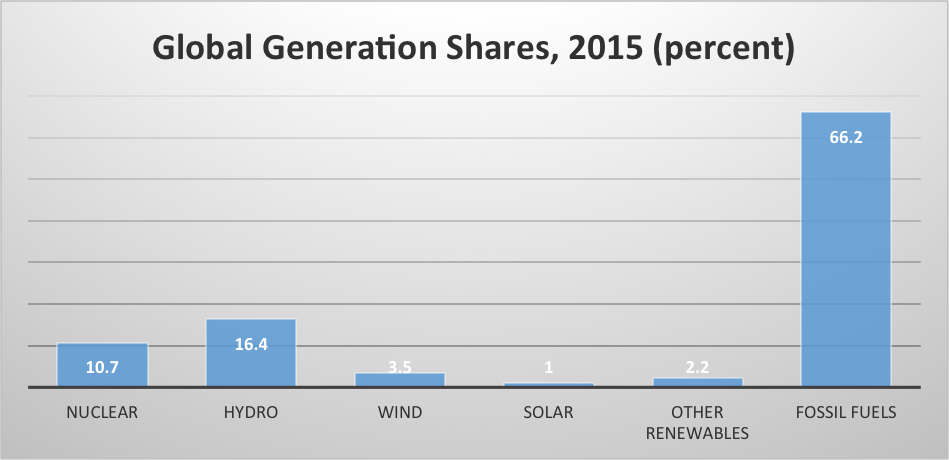
In 2015, renewable energy including hydroelectric power contributed 23 percent to total global generation, nuclear power contributed 11 percent and the remaining 66 percent was supplied by fossil fuels–mainly coal and natural gas. In fact, according to the BP Statistical Review, wind and solar together contributed a mere 4.5 percent of global electricity in that year. (See chart below.)

Source: http://www.bp.com/en/global/corporate/energy-economics/statistical-review-of-world-energy.html
IEA Renewable Report
The latest edition of the IEA’s Renewable Market Report has upped the expected growth rate of renewable energy by 13 percent more between 2015 and 2021 than it did in last year’s forecast, due primarily to stronger government policies in the United States, China, India and Mexico. Further, the agency expects costs to drop by 25 percent for solar PV and 15 percent for onshore wind to get the increased capacity.[ii]
According to the IEA, in 2015, renewable energy represented over half the new power capacity growth globally with a total of 153 gigawatts added—an increase of 15 percent from the previous year. Wind capacity additions totaled 66 gigawatts and solar PV additions totaled 49 gigawatts. China installed about half the wind capacity additions and about 40 percent of all renewable capacity increases.
IEA expects renewable energy, including hydroelectric power, to remain the fast growing source of electricity generation over the next five years with their share growing to 28 percent in 2021 from 23 percent in 2015—an increase of almost 37 percent in generation. By 2021, IEA expects generation from renewables to exceed 7600 terawatt hours, which is almost equivalent to the total electricity generation of the United States and the European Union in 2015 according to the BP Statistical Review. (See IEA’s infographic below.)

Issues with IEA’s Forecast
However, as the IEA notes, while China represents 40 percent of global renewable power growth, renewable energy represents only half of the country’s electricity demand increase in IEA’s forecast. It is also true that renewable energy growth in India, Asia, and Africa represents only a fraction of their total electricity generation growth from 2015 to 2021.[iii] (See graph below.)
Source: IEA, https://www.iea.org/newsroom/speeches/MTRMR_2016_Launch_Presentation_FINAL_for_web.pdf
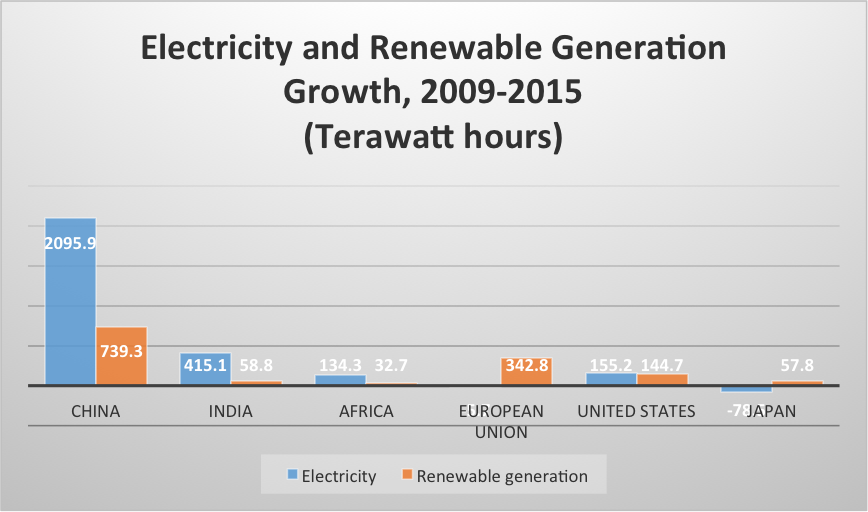
The following chart compares electricity and renewable generation growth over the past 5 years for the countries above except for ASEAN, for which data was unavailable for 4 of the ASEAN countries in the BP statistical review data base. The comparison is interesting. For example, over the past 5 years, renewable energy represented 35 percent of the increase in China’s electricity demand, but the majority of that increase (69 percent) was due to increased hydroelectric power. In India, over the past 5 years, renewable energy represented just 14 percent of the increase in electricity generation. For the European Union, the United States, and Japan, renewable energy replaced some of the generation lost from other sources. In Japan, nuclear generation was mostly retired after the tsunami hit in 2011. In the United States, natural gas and renewable energy replaced some coal-fired generation due to onerous regulations and inexpensive natural gas. In Germany, renewable energy was used to phase out its nuclear power generation, increasing prices 3-fold.
Source: http://www.bp.com/en/global/corporate/energy-economics/statistical-review-of-world-energy.html
Further, the capacity that China, India, Africa, and other Asian countries will add from nuclear power, coal, and natural gas will have much higher capacity factors than wind and solar power and thereby generate far more electricity per unit of capacity than wind and solar power.
According to the Energy Information Administration (EIA), new nuclear power plants can achieve capacity factors of 90 percent, new coal-fired plants can achieve capacity factors of 85 percent and new natural gas-fired plants can achieve capacity factors of 87 percent. That compares to capacity factors for wind and solar that are a quarter to half that amount–new wind turbines are expected to achieve maximum capacity factors of only 42 percent and solar PV of only 26 percent. That means while countries may be building wind and solar plants, they have to add double to triple the capacity to achieve the same amount of power as nuclear, coal, or natural gas plants.[iv]
In addition, according to the EIA, even with the lucrative subsidies that the United States government provides for solar power, it is still not cost competitive with natural gas plants entering service in 2022.
Also, while IEA notes that renewable energy achieved a 23 percent share in 2015 and is expected to achieve a 28 percent share in 2021, the agency does not mention that hydroelectric power produced 71 percent of the 23 percent renewable share. Together, wind and solar power only attained a 4.5 percent share of global generation in 2015. And even if wind and solar power could claim all of the increase that IEA’s forecast shows in generation between 2015 and 2021, wind and solar power would represent at most a 9.5 percent share in 2021. However, because there are more hydroelectric, geothermal, and biomass units being constructed worldwide, the share of generation from wind and solar power will be even less in 2021 than that 9.5 percent share.
U.S. Natural Gas Production Growth Outdistances Wind and Solar Power Growth
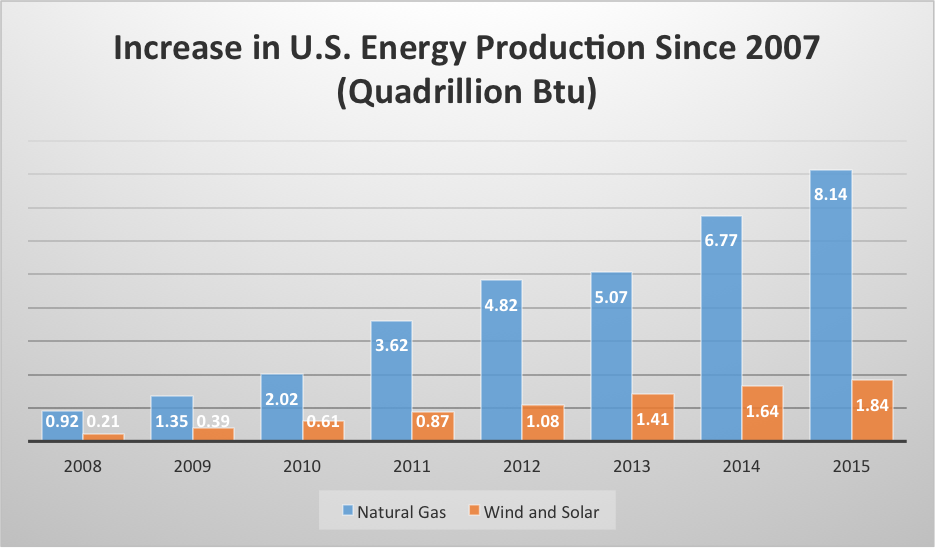
In fact, not only are fossil fuels such as natural gas and coal providing more power globally, but in the United States, energy production from natural gas is growing faster than energy production from wind and solar. Since 2007, wind production grew by 433 percent and solar production grew by 573 percent. These percentage increases are impressive only because these sources produced only a relatively small amount of energy in 2007 and still produced a small fraction of the energy in 2015 that the U.S. economy needs. When compared with the energy produced by natural gas during the same time period, wind and solar energy production clearly have a long way to go to demonstrate their relevance in the energy industry as the chart below shows.

Source: EIA, http://www.eia.gov/totalenergy/data/monthly/pdf/sec1_5.pdf
Conclusion
The IEA is forecasting substantial growth in the capacity of wind and solar power in its Medium-Term Renewable Energy Market Report. Using capacity as a measure for electricity growth, however, is not commensurate with growth in generation because wind and solar units cannot compete with nuclear, coal and natural gas units, whose capacity factors are far superior. Further, while renewable energy did achieve a 23 percent share of global generation in 2015, hydroelectric power represented over 70 percent of that generation share. Together, wind and solar power only attained a 4.5 percent share of global generation in 2015 and at most can only achieve a 9.5 percent share in 2021.
[i] International Energy Agency, Medium-Term Renewable Energy Market Report 2016, October 2016, https://www.iea.org/bookshop/734-Medium-Term_Renewable_Energy_Market_Report_2016
[ii] International Energy Agency, IEA raises its five-year renewable growth forecast as 2015 marks record year, October 25, 2016, https://www.iea.org/newsroom/news/2016/october/iea-raises-its-five-year-renewable-growth-forecast-as-2015-marks-record-year.html
[iii] International Energy Agency, Presentation, October 25, 2016, https://www.iea.org/newsroom/speeches/MTRMR_2016_Launch_Presentation_FINAL_for_web.pdf
[iv] Energy Information Administration, Levelized Cost of New Generation Resources in AEO 2016, August 2016, http://www.eia.gov/forecasts/aeo/pdf/electricity_generation.pdf
The post Why You Should be Wary of IEA’s Renewable Forecast appeared first on IER.


No comments:
Post a Comment